27 Jan 2014 AMC- Market continues 3rd losing streak, having its first DFDM in 2014
Market Summary

Before Market Opens
S&P futures vs fair value:
+3.50. Nasdaq futures vs fair value: +3.00.
The S&P 500 futures trade roughly four points above fair value.
Markets across Asia ended broadly lower as Friday's concerns surrounding emerging markets carried over into the Asian session. The concerns were highlighted by action in the foreign exchange market as the Malaysian ringgit (MYR), Philippines peso (PHP), and Taiwan dollar (TWD) all moved to multi-year lows against the U.S. dollar. Markets across the region will be closed for parts of the next week in observance of the Lunar New Year.
In economic data, Japan's trade deficit widened to JPY1.30 trillion from JPY1.29 trillion (deficit of JPY1.22 trillion expected) as exports rose 15.3% (17.8% forecast, 18.4% prior) and imports expanded 24.7% (26.1% consensus, 21.1% last). In addition, the adjusted trade deficit narrowed to JPY1.15 trillion from JPY1.29 trillion (JPY1.33 trillion forecast). Elsewhere, Hong Kong's trade deficit widened to HKD54.40 billion from HKD44.60 billion (HKD46.00 billion forecast).
·
Japan's Nikkei tumbled 2.5% to a two-month low.
Exporters were hit hard as the yen strengthened. Sony lost 3.1% and Nissan
Motor gave up 2.2%.
·
Hong Kong's Hang Seng lost 2.1%,
sinking to its lowest level in five-months. Energy stocks lagged as CNOOC fell
3.5% and China Shenhua Energy lost 3.3%.
·
China's Shanghai Composite fell 1.0%, seeing some
selling ahead of the Lunar New Year. Insurance names were weak with China Life
and Ping An sliding 4.1% and 3.8%, respectively.
Most major European indices trade
little changed while Great Britain's FTSE (-1.1%) lags. Economic data was
limited to Germany's Ifo Business Climate Index, which ticked up to 110.6 from
109.5 (110.0 forecast) as Business Expectations improved to 108.9 from 107.4
(108.0 expected) and Current Assessment rose to 112.4 from 111.6, as
expected.
Among news of note, when asked about the possibility of launching a quantitative easing program, European Central Bank President Mario Draghi said the ECB may buy securitized bank loans packaged as asset-backed securities. Elsewhere, Moody's affirmed the sovereign debt rating of France at ‘Aa1' while maintaining a ‘negative' outlook.
Among news of note, when asked about the possibility of launching a quantitative easing program, European Central Bank President Mario Draghi said the ECB may buy securitized bank loans packaged as asset-backed securities. Elsewhere, Moody's affirmed the sovereign debt rating of France at ‘Aa1' while maintaining a ‘negative' outlook.
·
Great
Britain's FTSE is lower by 1.1% as
BG Group and Vodafone weigh. BG Group has tumbled 14.5% after issuing a profit
warning while Vodafone displays a loss of 5.5% after AT&T ruled out a bid
for the company.
·
Germany's DAX trades flat. Drug maker Merck is lower by
10.5% after its Chief Financial Officer left the company to join Lanxess, which
is the top performer with a gain of 8.2%.
·
In
France, the CAC is higher by
0.1% as financials display strength. BNP Paribas and Societe Generale sport
respective gains of 1.5% and 1.3%. On the downside, Electricite de France is
lower by 1.6%.
Market Internals

The Nasdaq closed down 45 (-1.08%) at 4084, the S&P 500 closed down 9 (-0.49%) at 1782, and the Dow closed down 41 (-0.26%) at 15838. Action came on above average volume (NYSE 764 mln vs. avg. of 684; NASDAQ 2272 mln vs. avg. of 1787), with decliners outpacing advancers (NYSE 824/2318, NASDAQ 599/2035) and new lows outpacing new highs (NYSE 32/100, NASDAQ 50/53).
Relative Strength:
Cocoa-NIB +4%, Turkey-TUR +3.79%, Volatility-VXX +1.57%, Vietnam-VNM +0.88%, South Korea-EWY +0.87%, Australian Dollar-FXA +0.62%, Israel-EIS +0.52%, Corn-CORN +0.49%, Livestock-COW +0.32%, Utilities-XLU +0.24%.
Relative Weakness:
Junior Gold Miners-GDXJ -5.24%, Natural Gas-UNG -5.04%, Biotechnology-XBI -4.2%, Silver Miners-SIL -3.55%, Cotton-BAL -3.44%, India-INP -1.74%, Indonesia-IDX -1.68%, Taiwan-EWT -1.66%, Emerging Markets Small Cap-EWX -1.63%, Canada-EWC -1.46%.

Market Internals -Technical-
The Nasdaq closed down 45 (-1.08%) at 4084, the S&P 500 closed down 9 (-0.49%) at 1782, and the Dow closed down 41 (-0.26%) at 15838. Action came on above average volume (NYSE 764 mln vs. avg. of 684; NASDAQ 2272 mln vs. avg. of 1787), with decliners outpacing advancers (NYSE 824/2318, NASDAQ 599/2035) and new lows outpacing new highs (NYSE 32/100, NASDAQ 50/53).
Relative Strength:
Cocoa-NIB +4%, Turkey-TUR +3.79%, Volatility-VXX +1.57%, Vietnam-VNM +0.88%, South Korea-EWY +0.87%, Australian Dollar-FXA +0.62%, Israel-EIS +0.52%, Corn-CORN +0.49%, Livestock-COW +0.32%, Utilities-XLU +0.24%.
Relative Weakness:
Junior Gold Miners-GDXJ -5.24%, Natural Gas-UNG -5.04%, Biotechnology-XBI -4.2%, Silver Miners-SIL -3.55%, Cotton-BAL -3.44%, India-INP -1.74%, Indonesia-IDX -1.68%, Taiwan-EWT -1.66%, Emerging Markets Small Cap-EWX -1.63%, Canada-EWC -1.46%.


Leaders and Laggards


Technical Updates


Briefing's Commentaries
Closing Market Summary: Stocks Slump
as Technology Weighs
The major averages followed last week's sharp losses with another shaky performance. The Dow Jones Industrial Average and S&P 500 posted respective declines of 0.3% and 0.5% while the Nasdaq (-1.1%) and Russell 2000 (-1.5%) underperformed.
Stocks displayed gains at the open but the early strength faded during the initial hour as the Nasdaq headed into the red. The other indices followed suit and the broad retreat continued until about 12:20 ET when stocks reversed and spent the afternoon in a steady climb. Moderate selling pressure returned during the final hour, knocking the indices off their afternoon highs.
Although there was no news responsible for the turn, the morning selling coincided with a strengthening yen while the session low in equities matched the high point for the Japanese currency. Once the yen began weakening again, a rally in equities ensued. Similarly, the selling observed during the last 30 minutes of action coincided with the yen gaining strength once again.
The Dow and S&P 500 held up relatively well compared to the tech-heavy Nasdaq. The index suffered after being hit with a one-two punch of selling interest as large cap tech names and biotechnology retreated. The tech sector (-1.0%) finished at the bottom of the leaderboard while the iShares Nasdaq Biotechnology ETF (IBB 238.60, -5.42) lost 2.2% and also pressured the health care sector (-0.8%).
Even though technology underperformed, its largest component, Apple (AAPL 550.50, +4.43) added 0.8% ahead of its after-hours earnings report.
Elsewhere among cyclical groups, the industrial sector (+0.2%) drew strength from Caterpillar (CAT 91.29, +5.12) after the Dow component reported above-consensus results and announced a $10 billion buyback program. Transports, however, did not take part in the rally. The bellwether complex lost 0.8% after plunging 4.1% on Friday.
On the countercyclical side, health care (-0.8%) lagged while consumer staples (-0.3%), telecom services (+0.1%), and utilities (+0.2%) outperformed.
The early selling fueled a scramble for downside protection, which sent the CBOE Volatility Index (VIX 17.51, -0.63) as high as 18.99%. However, the subsequent rebound invited many to lift their hedges. As a result, the near-term volatility measure ended lower by 3.5%.
Treasuries finished on their lows with the benchmark 10-yr yield up five basis points at 2.77%.
Participation was a bit above average as 764 million shares changed hands at the NYSE.
Today's economic data was limited to the December New Home Sales, which fell 7.0% to 414,000 from a downwardly revised 445,000 (from 464,000) while the Briefing.com consensus pegged the reading at 457,000. Total sales in 2013 increased 16.3% to 428,000 from 368,000 in 2012. That was the most new homes sold since 485,000 sales registered in 2008. Although that may seem like a lot, more than a million new homes were sold each year from 2003 to 2006.
We hypothesized that the strong sales performance in October and November was due to buyers rushing into the market to take advantage of relatively low interest rates in a rising interest rate environment. The large December decline adds evidence to this theory as the push forward in demand dried up and sales levels returned to where they were during the lackluster summer period. Another drop in January would deliver more credence to the contention that gains in October and November were not from sustainable demand growth.
Tomorrow, December Durable Orders will be released at 8:30 ET while the November Case-Shiller 20-city Index and January Consumer Confidence will cross the wires at 9:00 ET and 10:00 ET, respectively.
·
Nasdaq Composite -2.2%
YTD
·
Russell 2000 -3.1%
YTD
·
S&P 500 -3.6%
YTD
·
Dow Jones Industrial
Average -4.5% YTD
Commodities
Closing Commodities: Natural Gas Drops 7%, Falls Back Below
$5/MMBtu
Natural gas futures sold off today nicely following a huge rally, which
pushed futures above $5/MMBtu late last week (over the weekend).
Today, Feb natural gas sold off $0.35/MMBtu (or -7%) to $4.68/MMbtu, following
profit-taking.
Crude oil futures sold off early this morning and remained near its LoD
for most of the session. Mar crude ended $0.94 lower at $95.78/barrel.
Precious metals ended the day mixed with Feb gold losing $1.5 to
$1263/oz and Mar silver gaining $0.04 to $19.80/oz
COMEX
Metals Closing Prices
·
Feb gold fell $1.50 to
$1263/oz
·
Mar silver rose $0.04 to
$19.80/oz
·
Mar copper fell 1 cent
to $3.26/lbs
CBOT
Agriculture and Ethanol/ICE Sugar Closing Prices
·
Mar corn rose 3 cents to
$4.32/bushel
·
Mar wheat fell 2 cents
to $5.64/bushel
·
Mar soybeans rose 2
cents at $12.88/bushel
·
Feb ethanol fell 2 cents
to $1.76/gallon
NYMEX Energy Closing Prices
·
Mar crude oil fell $0.92
to $95.78/barrel
·
Feb natural gas fell 35
cent to $4.68/MMBtu
·
Mar heating oil fell 5
cents to $2.97/gallon
·
Mar RBOB fell 3 cents to
$2.64/gallon
Treasuries
Treasuries
Finish on Lows: 10-yr: -12/32..2.764%..USD/JPY: 102.69..EUR/USD: 1.3671
Treasuries ended on their lows as a recovery in risk prompted an afternoon
slide. Click here to see an
intraday yields chart.
The complex drifted lower over the course of the morning as equity futures
were bid, but staged a rally back into the green amid the selling of equities
at the open and the disappointing new home sales (414K actual v. 457K
expected).
The early bid caused maturities across the complex to test key
resistance, but trade once again failed at those levels as sellers held
strong.
Trade chopped around the flat line into the lunch hour before afternoon
selling dropped maturities to their lows into the cash close.
Selling was pretty well dispersed along the curve with most yields
ending +3bps.
The 10y saw an early test of the 2.700% support level, but finished the
session +3bps near 2.765%.
An early bid in 30s dropped the yield on the long bond below 3.650%, but
the afternoon selling made for a +3bp finish @ 3.680%.
Selling swung the yield curve steeper with the 2-10-yr spread
widening to 241.5bps.
Precious metals lost ground with gold falling $11 to $1253 and silver
sliding $0.18 to $19.59.
Data: Durable orders (8:30), Case-Shiller 20-city Index (9), and
consumer confidence (10).
Auction:
$32 bln 2y notes.
Next Day In View

Economic Commentary
Economic Summary: New Home sales
miss expectations; Durable Goods tomorrow at 8:30; Fed Decision Wednesday at
14:00
Economic Data Summary:
Economic Data Summary:
·
December
New Home Sales 414K vs Briefing.com consensus of 457K; November was revised to
445K from 464K
o That was the most new homes sold since 485,000
new homes were sold in 2008. That may seem like a lot but more than a million
new homes were sold each year from 2003 to 2006. We hypothesized that the
strong sales performance in October and November was due to buyers rushing into
the market to take advantage of relatively low interest rates in a rising
interest rate environment. The large December decline adds evidence to this
theory as the push forward in demand dried up and sales levels returned to
where they were during the lackluster summer period.
Upcoming Economic Data:
·
December
Durable Orders due out Tuesday at 8:30 (Briefing.com consensus of 2.1%; November
was 3.5%)
·
December
Durable Goods Ex-Transportation due out Tuesday at 8:30 (Briefing.com consensus
of 0.6%; November was 1.2%)
·
November Case Schiller
20 City Index due out Tuesday at 9:00 (Briefing.com consensus of 13.8%; October
was 13.6%)
·
January Consumer
Confidence due out Tuesday at 10:00 (Briefing.com consensus of 77.5; December
was 78.1)
Upcoming Fed/Treasury Events:
·
The Treasury is
scheduled to auction off $102 bln in new debt this week. The results for
each auction will be announced at 13:00
o Tuesday $32 bln in 2 year notes
o Thursday: $35 bln in 5 year notes & $29 bln
in 7 year notes.
·
The
Fed will begin a two day meeting tomorrow. The committee will update its policy
Wednesday at 14:00 (no press conference or econ projections will be released
after this meeting).
Other International Events of
Interest
·
Japan's trade deficit
widened to JPY1.30 trillion from JPY1.29 trillion (deficit of JPY1.22 trillion
expected) as exports rose 15.3% (17.8% forecast, 18.4% prior) and imports
expanded 24.7% (26.1% consensus, 21.1% last). In addition, the adjusted trade
deficit narrowed to JPY1.15 trillion from JPY1.29 trillion (JPY1.33 trillion
forecast).
·
Germany's Ifo Business
Climate Index ticked up to 110.6 from 109.5 (110.0 forecast) as Business
Expectations improved to 108.9 from 107.4 (108.0 expected) and Current
Assessment rose to 112.4 from 111.6, as expected.
·
Moody's affirmed the
sovereign debt rating of France at ‘Aa1' while maintaining a ‘negative'
outlook.
On other news....
Currencies
Dollar Drifts Little Changed: 10-yr:
-11/32..2.759%..USD/JPY: 102.66..EUR/USD: 1.3670
·
The Dollar Index has
spent almost the entire session hugging the flat line as trade lingers near
80.45. Click here to see a
daily Dollar Index chart.
·
The quiet session comes
as traders ready for the Fed's two-day meeting, which kicks off tomorrow and is
the final under the leadership of Ben Bernanke.
·
EURUSD is flat @ 1.3675 as trade has spent the entire
U.S. session in a tight 30 pip range. The single currency spiked to its best
levels of the day (1.3715) following the German Ifo Business Climate
beat, but trade has slipped back below 1.3700 resistance.
·
GBPUSD is +100 pips @ 1.6575 as an aggressive bid has won
back the majority of Friday's losses. Today's advance comes ahead of tomorrow's
preliminary GDP reading, which many believe will continue to show signs of
a recovery in Britain. However, one should not discount the economic impact of
the 2012 London Olympics, and the possibility any growth coming as a result of
those games is dissipating. Minor support rests in the 1.6450 area while 1.6300
is more important level. Any print above the 1.6550 mark would be the best
since May 2011.
·
USDCHF is +25 pips @ .8965 amid a rather uneventful
session. Action has seen a bid from the open, but a lack of data and news has
left action stuck in a tight 30 pip range during U.S. trade.
·
USDJPY is +25 pips @ 102.60 as action has won back most
of the early losses. Overnight selling pushed the pair below the 102.00
level for the first time since early-December; however, a steady bid over
the course of the session has aided the return to risk assets. The 103.00 level
is now being looked at as resistance.
·
AUDUSD is +75 pips @ .8755 as trade has recovered
almost all of Friday's losses. Aiding the hard currency were reports
out of China that the troubled China Credit Trust has reached an agreement to
restructure its troubled high-yield product. Near-term resistance in
the .8850/.8900 area will be watched closely. Australia's CB Leading Index and
NAB Business Confidence are due out tonight.
·
USDCAD is +5 pips @ 1.1090 as trade has won back its
early losses. Today's action has been rather uneventful as the pair
lingers near its best levels since July 2009.
Jason's Commentaries
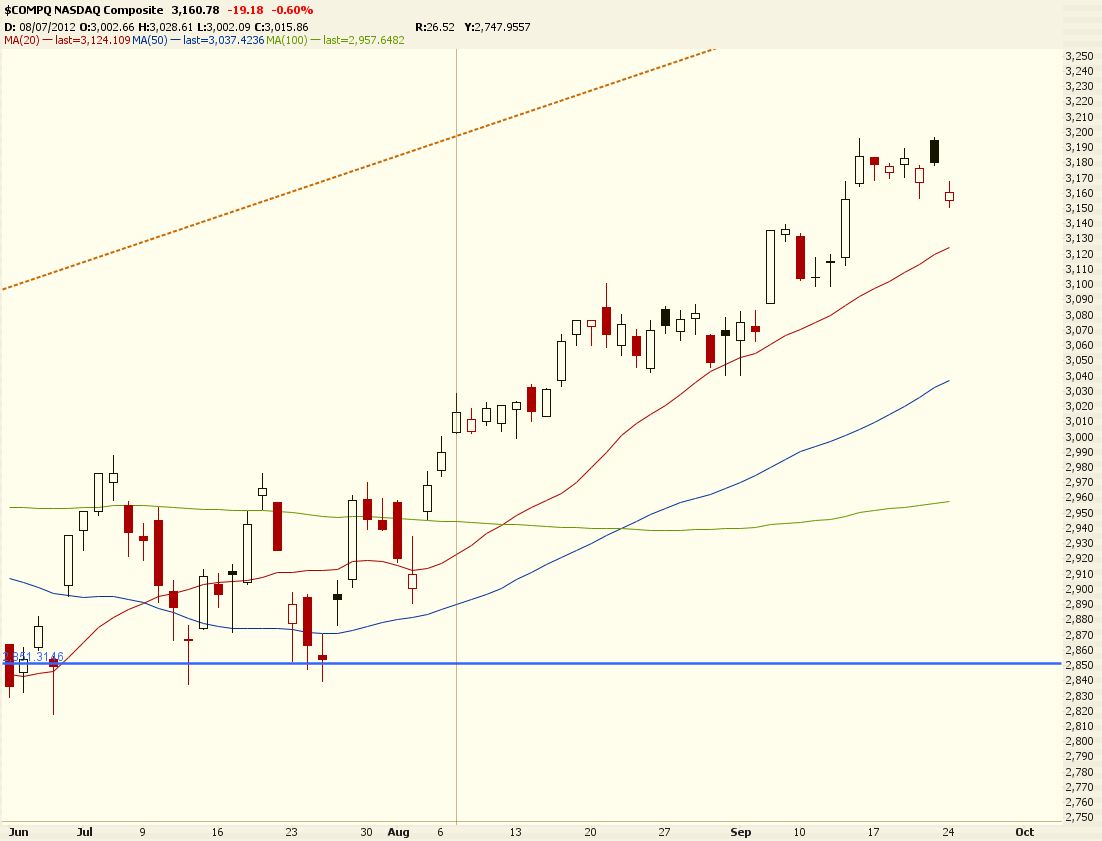
The first DFDM in 2014. A few more days to the end of Jan and the January Barometer it seems that it is likely to end with a loss. The market started last night with a bearish intent but reversed at 12pm but sold off again during the last hour. Nasdaq was the main laggard last night which drag the market down along with it. Names like Google, Microsoft, Orcale, Yahoo lost more than 1.5%. The Financial sector also ended in the red last night. The industrials and Utilities were up last night amidst those bearishness. While looking at the internals, there are much divergence in the internals. Volumes were quite healthy as well. On the technical side, we're looking at some support level and is likely to bounce ahead of the FOMC statements tomorrow We're looking at a likely bounce off the support today, assuming if Apple does not drag the market down as Apple released its earnings last night. Beating EPS but missing its revenues. Doesn't look good.
Market Call: FLAT to upside
Date: 28 Jan 2014
No comments:
Post a Comment