21 Feb 2014 AMC - Market facing resistance with tech lagging
Market Summary

http://finviz.com/
Before Market Opens
Market Internals
http://briefing.com/investor/markets/market-internals/
http://briefing.com/Investor/Markets/Market-Internals/nyse/2015/01/23


http://briefing.com/Investor/Markets/Market-Internals/nasdaq/2015/01/23

http://www.cboe.com/data/mktstat.aspx
http://www.cboe.com/data/mktstat.aspx
Leaders and Laggards

http://finviz.com/map.ashx?t=sec
Technical Updates
Commentaries
23-Jan-15 16:10 ET
Dow -141.38 at 17672.60, Nasdaq +7.48 at 4757.88, S&P -11.33 at 2051.82
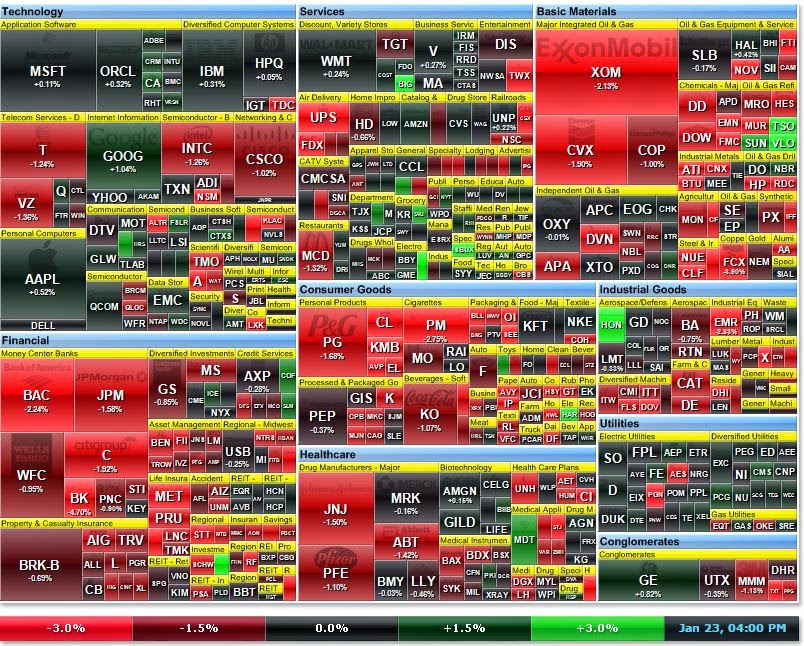
[BRIEFING.COM] The stock market capped a solid week with a shaky Friday session. The S&P 500 lost 0.6%, but still gained 1.6% for the week while the Nasdaq Composite (+0.2%) was able to register its fifth consecutive advance.
Equity indices began the day amid selling activity that started in the futures market after UPS (UPS 102.93, -11.32) issued disappointing guidance due to weakness in the U.S. domestic segment. The logistics company plunged below its 100-day moving average to end lower by 9.9%. The big loss weighed on the Dow Jones Transportation Average, which lost 1.8% and pressured the industrial sector (-0.8%).
The S&P 500 followed the opening slip with an eight-point rally off its morning low after European Central Bank member Benoit Coeure said the bank will need to do more if the quantitative easing program that was announced yesterday does not produce the desired outcome.
Despite the morning charge off session lows, the index never made it into the green and slid to a new low during the final hour of the trading day. The industrial sector kept the pressure on the market throughout the day while other influential groups like financials (-1.0%) and consumer staples (-1.1%) kept the S&P 500 from moving into the green.
The financial sector struggled despite better than expected reports from a slew of regional banks. The economically-sensitive group widened its January decline to 3.5% in response to a combination of slow global growth and sinking yields around the world.
Elsewhere, the consumer staples sector hovered near the bottom of the leaderboard after Kimberly-Clark (KMB 111.65, -7.33) reported below-consensus results and issued cautious guidance, which failed to justify the company's rich valuation.
Also of note, the energy space (-0.9%) spent the bulk of the day in-line with the market, but finished among the laggards as crude oil remained weak. The energy component showed overnight volatility after it was reported Saudi Arabia's King Abdullah has died.
WTI crude was able to make an intraday appearance in the green, but ended lower by 1.8% at $45.56/bbl. Once again, dollar strength was a headwind with the Dollar Index (94.92, +0.86) spiking 0.9%.
On the upside, utilities (+0.3%) and technology (+0.2%) were the only two advancers. The utilities sector solidified its spot atop the January leaderboard (+4.2%) while technology received support from large cap names. Chipmakers were not as fortunate with the PHLX Semiconductor Index ending lower by 0.3%. The high-beta group finished ahead of the S&P 500, but behind the tech sector after KLA-Tencor (KLAC 65.42, -5.53) issued disappointing guidance that overshadowed better than expected results.
Outside of technology, the consumer discretionary sector (-0.2%) was the only other group able to finish near its flat line. Starbucks (SBUX 88.12, +5.38) soared 6.5% even though its in-line report featured below-consensus guidance for the second quarter while McDonald's (MCD 89.56, -1.33) lost 1.5% after missing estimates and priming the market for negative comparable store sales in January.
Treasuries ended near their highs with the 10-yr yield sliding six basis points to 1.80%. Meanwhile, the long bond spiked to pressure its yield to the lowest close on record (2.39%).
Participation was a bit below average with roughly 765 million shares changing hands at the NYSE floor.
Economic data was limited to Existing Home Sales and Leading Indicators:
- Existing home sales increased 2.4% in December to 5.04 million SAAR from a downwardly revised 4.92 million SAAR (from 4.93 million SAAR) in November while the Briefing.com consensus expected an increase to 5.10 million SAAR.
- Improvements in the labor market, gains in stock prices, and a general decline in mortgage rates were not enough to boost housing demand in 2014. For the year, 4.93 million homes were sold, which was down 3.1% from the 5.09 million homes sold in 2013
- The Conference Board's Leading Economic Index increased 0.5% in December (consensus 0.5%) after increasing a downwardly revised 0.4% (from 0.6%) in November
- Nasdaq Composite +0.5% YTD
- S&P 500 -0.3% YTD
- Dow Jones Industrial Average -0.8% YTD
- Russell 2000 -1.1% YTD
Read more: http://briefing.com/investor/markets/stock-market-update/2015/1/23/stocks-slip-but-maintain-weekly-gains.htm#ixzz3PmdUQLL6
Commodities
Treasuries
On other news....
Currencies
Weekly Analysis
Technical Updates
Briefing's Commentaries
Week in Review: Action Driven By Central Banks
Bond and equity markets were closed on Monday for Martin Luther King Day
The stock market kicked off the holiday-shortened week with a shaky Tuesday session. The S&P 500 settled higher by 0.2% after finding intraday support near its 100-day moving average (2007/2008). The tech-heavy Nasdaq outperformed, climbing 0.4%. Equity indices started the day with modest gains, but continued weakness in crude oil weighed on the overall risk tolerance and contributed to an early retreat. However, a handful of influential sectors were able to withstand the selling pressure, which in turn became a supportive factor during afternoon action. As for crude, the energy component retreated after The International Monetary Fund cut its 2015 global growth outlook to 3.0% from 3.5%, and continued sliding throughout the session. WTI crude ended lower by 4.1% at $46.51/bbl while the energy sector (+0.1%) settled near its flat line. Baker Hughes (BHI) beat estimates, but announced plans to reduce its workforce by 7,000 employees.
Equities enjoyed their third consecutive advance on Wednesday with the S&P 500 climbing 0.5%. The Wednesday session was filled with central bank-related storylines. The Bank of Japan got the ball rolling overnight by lowering its inflation outlook to 1.0% from 1.7%, which boosted the yen (117.80). The Bank of England was next on tap with the minutes from its latest policy meeting. The minutes were a bit surprising as Messrs. McCafferty and Weale, who previously voted in favor of rate hikes, rejoined the majority in their belief that hiking rates too early would prolong the period of low inflation. Global equities jumped off their lows in reaction to reports indicating the European Central Bank is set to propose EUR50 billion in asset purchases through 2016. The euro wobbled on the news before ending the day near 1.1590 against the dollar. In a surprising move, Germany's 10-yr note tumbled, sending the benchmark yield higher by seven basis points to 0.47%. The Bank of Canada completed the central bank bonanza with a surprise 25-basis point cut to 0.75% in response to crashing oil prices, which are expected to put downward pressure on Canadian inflation. The loonie retreated to its lowest level since early 2009, sending USDCAD to 1.2330 from 1.2070.
The major averages registered their fourth consecutive advance on Thursday with the S&P 500 (+1.5%) reclaiming its 50-day moving average (2046/2047). The benchmark index erased its January loss while the Russell 2000 (+2.0%) displayed relative strength throughout the day. This week featured action from several major central banks and that extravaganza was topped off on Thursday when the European Central Bank announced the highly-anticipated launch of a quantitative easing program in the amount of EUR60 billion per month. In short, the program is aimed at stopping deflation that is due, in part, to low oil prices. However, the thought process behind the action is a bit questionable considering QE is expected to weigh on the euro, which will boost the dollar, thus putting pressure on dollar-denominated commodities like crude oil, which is at the root of eurozone's deflationary tilt.
Read more: http://briefing.com/investor/markets/stock-market-update/2015/1/23/stocks-slip-but-maintain-weekly-gains.htm#ixzz3PmdQeGma
Next Week In View

http://www.forexfactory.com/calendar.php?week=jan25.2015
Economic Commentaries
Jason's Commentaries
Market Call: FLAT to upside
Date: 24 Feb 2014


