21 Feb 2014 AMC - Market facing resistance with tech lagging
Market Summary

Before Market Opens
Market Internals


Leaders and Laggards

Technical Updates


Commentaries
Closing Market Summary: Stocks Rally to
Snap Five-Day Losing Streak
The major averages snapped their five-day losing streak with a broad-based advance on Friday. The S&P 500 (+1.3%) reclaimed its 100-day moving average (2,007) and narrowed its weekly decline to 1.2%.
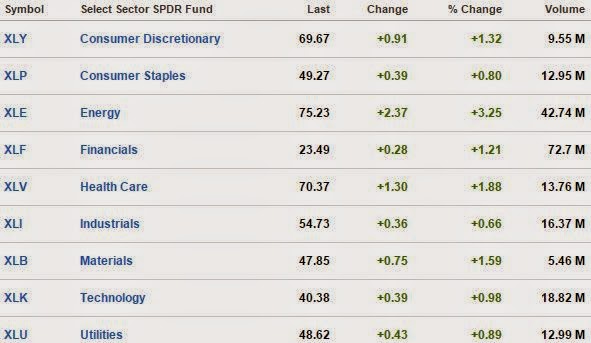
The stock market was on shaky footing in the early going, but the overall risk tolerance was improved by a rebound in crude oil, which continued climbing throughout the session to end higher by 4.6% at $48.50/bbl. That advance bolstered the energy sector (+3.2%), which spent the day in the lead.
Meanwhile, the remaining cyclical groups ended a bit closer to their flat lines. The materials sector (+1.7%) outperformed with help from steelmakers and miners while the discretionary sector (+1.3%) settled in line with the broader market. As for the remaining three growth-sensitive groups, financials (+1.2%), industrials (+0.7%), and technology (+0.9%) spent the day behind the broader market.
The financial sector could not catch up to the S&P 500 as Goldman Sachs (GS 177.23, -1.26) weighed. The stock fell 0.7% despite better than expected results from the investment bank. Also of note, foreign exchange broker FXCM (FXCM 12.63, 0.00) agreed to terms on a $300 million lifeline provided by Leucadia National (LUK 21.84, +0.20) after yesterday's surge in the Swiss franc caused about $225 million in negative client balances at FXCM. Shares of FXCM were halted throughout the session after surrendering almost 90.0% in pre-market action.
Elsewhere, the technology sector struggled to keep pace with the market as Apple (AAPL 105.94, -0.88) weighed. The largest sector component lost 0.8% while most other heavily-weighted tech names settled with gains. On the earnings front, Intel (INTC 36.45, +0.26) gained 0.7% after beating bottom-line estimates. For its part, the PHLX Semiconductor Index (+1.1%) ended just behind the S&P 500.
Over on the countercyclical side, consumer staples (+0.8%) and utilities (+0.9%) underperformed throughout the day while telecom services (+1.7%) and health care (+1.9%) spent the day among the leaders. The health care sector was bolstered by high-beta biotechnology names, evidenced by a 3.3% gain in the iShares Nasdaq Biotechnology ETF (IBB 317.82, +10.12). The ETF was able to add 1.4% for the week versus a slim uptick of 0.2% for the health care sector.
Treasuries notched their highs in the early morning before spending the session in a steady retreat that sent the benchmark 10-yr yield higher by 11 basis points to 1.82%.
Friday's participation was ahead of average with 950 million shares changing hands at the NYSE floor.
Economic data included CPI, Industrial Production, and Michigan Sentiment:
The major averages snapped their five-day losing streak with a broad-based advance on Friday. The S&P 500 (+1.3%) reclaimed its 100-day moving average (2,007) and narrowed its weekly decline to 1.2%.
The stock market was on shaky footing in the early going, but the overall risk tolerance was improved by a rebound in crude oil, which continued climbing throughout the session to end higher by 4.6% at $48.50/bbl. That advance bolstered the energy sector (+3.2%), which spent the day in the lead.
Meanwhile, the remaining cyclical groups ended a bit closer to their flat lines. The materials sector (+1.7%) outperformed with help from steelmakers and miners while the discretionary sector (+1.3%) settled in line with the broader market. As for the remaining three growth-sensitive groups, financials (+1.2%), industrials (+0.7%), and technology (+0.9%) spent the day behind the broader market.
The financial sector could not catch up to the S&P 500 as Goldman Sachs (GS 177.23, -1.26) weighed. The stock fell 0.7% despite better than expected results from the investment bank. Also of note, foreign exchange broker FXCM (FXCM 12.63, 0.00) agreed to terms on a $300 million lifeline provided by Leucadia National (LUK 21.84, +0.20) after yesterday's surge in the Swiss franc caused about $225 million in negative client balances at FXCM. Shares of FXCM were halted throughout the session after surrendering almost 90.0% in pre-market action.
Elsewhere, the technology sector struggled to keep pace with the market as Apple (AAPL 105.94, -0.88) weighed. The largest sector component lost 0.8% while most other heavily-weighted tech names settled with gains. On the earnings front, Intel (INTC 36.45, +0.26) gained 0.7% after beating bottom-line estimates. For its part, the PHLX Semiconductor Index (+1.1%) ended just behind the S&P 500.
Over on the countercyclical side, consumer staples (+0.8%) and utilities (+0.9%) underperformed throughout the day while telecom services (+1.7%) and health care (+1.9%) spent the day among the leaders. The health care sector was bolstered by high-beta biotechnology names, evidenced by a 3.3% gain in the iShares Nasdaq Biotechnology ETF (IBB 317.82, +10.12). The ETF was able to add 1.4% for the week versus a slim uptick of 0.2% for the health care sector.
Treasuries notched their highs in the early morning before spending the session in a steady retreat that sent the benchmark 10-yr yield higher by 11 basis points to 1.82%.
Friday's participation was ahead of average with 950 million shares changing hands at the NYSE floor.
Economic data included CPI, Industrial Production, and Michigan Sentiment:
·
The CPI
declined 0.4% in December after declining 0.3% in November while the
Briefing.com Consensus expected a decline of 0.4%
o Prices are up only 0.8% year-over-year, which is
the smallest increase since October 2009
o The energy index, which has fallen for the past
six consecutive months, declined 4.7% in December
o Food prices increased 0.3% in December, up from
a 0.2% increase in November
o Excluding food and energy, core CPI was flat in
December (consensus +0.1%) after increasing 0.1% in November
·
Industrial
production declined 0.1% in December after increasing an unrevised 1.3% in
November (Briefing.com consensus -0.1%)
o The decline in industrial production can be
blamed on warmer-than-normal temperatures that reduced the demand for heating.
According to the National Climatic Data Center, December 2014 was the second
warmest December on record. That was a large reversal from November, which was
the coldest November since 2000. The shift in temperatures resulted in a 7.3%
decline in utilities production
o Capacity utilization hit 79.7% while the
Briefing.com consensus expected a reading of 79.9%
·
The
University of Michigan Consumer Sentiment Index jumped to 98.2 in the
preliminary January reading from 93.6 in December while the Briefing.com
consensus expected an increase to 94.1
o That was the highest reading since the index
reached 103.8 in January 2004
Bond and equity markets will be closed
on Monday for Martin Luther King Day.
On Tuesday, the NAHB Housing Market Index will be released at 10:00 ET.
On Tuesday, the NAHB Housing Market Index will be released at 10:00 ET.
·
Dow Jones
Industrial Average -1.8% YTD
·
S&P
500 -1.9% YTD
·
Nasdaq
Composite -2.2% YTD
·
Russell
2000 -2.5% YTD
Commodities
Treasuries
30Y Sinks to All-Time Low: 10Y:
-30/32.1.816%..USD/JPY: 117.49..EUR/USD: 1.1564
The Week in Review
The Week in Review
·
Treasuries
rallied throughout the week and extended their streak to 15 gains in 16
sessions. Click here to see an intraday
yields chart.
·
Rate
differentials with Europe remained a driver as money continued to pour into
higher yielding U.S. debt
·
Aiding
the advance was the decision by the Swiss National Bank to end its
EUCHF1.20 floor. The announcement caused panic all over the world and
pushed money into the safety of the complex.
·
U.S.
economic data was mixed. Retail sales (-0.9% actual v. +0.1% expected) and Philly Fed (9.9
actual v. 6.5 expected) missed while Empire Manufacturing (9.9 actual v. 6.5
expected) and Michigan Sentiment (98.2 actual v. 94.1 expected) outpaced
estimates. Pricing pressures were mixed as Core PPI (0.3% actual v. 0.1%
expected) was hot and Core CPI (0.0% actual v. 0.1% expected) was cool.
·
This
week's auctions started off strong, but disappointed as they progressed.
·
Monday's strong $24B
3Y note auction drew 92.6bps and a 3.33x bid/cover. Indirect bidders
(45.8%) provided support as directs (14.8%) were a bit light.
Primary dealers were left with just 39.4% of the supply.
·
Tuesday's $21B 10Y
note reopening disappointed. The reopening drew 1.930% (WI 1.916%) and a light
2.61x bid/cover. Indirect (50.0%) and direct (9.2%) bids both missed their
12-auction averages, leaving primary dealers with 40.8% of the
supply.
·
Wednesday's $13B 30Y
bond reopening was tepid. The reopening drew 2.430% (WI 2.411%) and a light
2.32x bid/cover. Indirect bids (48.9%) provided support as directs (13.7%)
missed their 12-auction averages. Primary dealers ended up with 37.4% of
the supply.
·
Up front,
the 2Y fell -10bps to 47.6bps. The yield broke below support in the 55bp area
on its way to printing at levels last seen around Halloween.
·
In the
belly, the 5Y eased -16bps to 1.283%. This week's action dropped the yield to
its lowest levels since June 2013.
·
The 10Y
shed -16bps to 1.815%. On Friday, the benchmark yield hit a 20-month of
1.700% before seeing a sharp reversal.
·
Buying at
the long end pushed the 30Y down -12bps to 2.435%. This week's action
dropped the yield on the long bond to a record low 2.353%.
·
A flatter
curve took hold as the 2-10-yr spread tightened to 134bps.
The Week Ahead
·
Markets
are closed Monday in observance of Martin Luther King Day.
·
Tuesday's
data is limited to the NHAB Housing Market Index (10).
·
Wednesday
will see the weekly MBA Mortgage Index (7), housing starts, and building
permits (8:30).
·
Data
continues to flow on Thursday as initial and continuing claims (8:30), and FHFA
Housing Price Index (9) are released.
·
Data for
the week concludes on Friday with existing home sales and
leading indicators (10).
On other news....
Currencies
Weekly Analysis
Technical Updates


Briefing's Commentaries
Week in Review: Slipping and Sliding
The stock market began the week on the defensive with the Nasdaq (-0.8%) and S&P 500 (-0.8%) pacing the Monday slide. The Dow (-0.5%) and Russell 2000 (-0.3%) outperformed, but the two indices also spent the bulk of the day in negative territory. Equities opened the trading day with slim gains that evaporated during the first few minutes of the session. The S&P 500 slumped back below its 50-day moving average (2046) at the start and spent the rest of the day well below that level as influential sectors weighed. Most notably, the energy sector (-2.8%) was the weakest performer with crude oil contributing to the pressure after Goldman Sachs lowered its short-term forecast for the commodity. WTI crude ended the pit session on its low, down 4.9% at $46.07/bbl. Meanwhile, the remaining cyclical groups registered slimmer losses, but heavily-weighted financials (-0.9%) and technology (-1.3%) kept the market under pressure throughout the session.
The major averages enjoyed broad-based support at the start of the Tuesday session, but the opposite was true when the trading day ended. The S&P 500 lost 0.3% with eight sectors settling in the red. The final standing masked the fact that the benchmark index was up in excess of 1.0% at the start of the day. The S&P 500 spent the first 90 minutes near its high, but the absence of intraday buying interest opened the door to a retreat that accelerated when the S&P cut through its 50-day moving average (2046/2047). Commodity-related sectors fueled the pullback from highs with energy (-0.7%) and materials (-1.2%) ending the day at the bottom of the barrel. The two groups struggled to keep pace with the market in the early going and their underperformance became more notable during the afternoon retreat.
Equities endured their fourth consecutive decline on Wednesday with the S&P 500 (-0.6%) making an intraday appearance below its 100-day moving average (2,007). The tech-heavy Nasdaq outperformed, but still lost 0.5%. Stocks faced selling pressure from the start after the overnight session failed to alleviate the growth concerns that contributed to the recent weakness. Instead, the concerns grew larger, starting with the World Bank's reduced growth outlook for 2015 (to 3.0% from 3.4%) and 2016 (to 3.3% from 3.5%). The lowered outlook pressured commodities, and especially copper, which remained under pressure throughout the day, ending lower by 4.9% at $2.51/lb after hitting a low near the $2.45/lb level. Crude oil, however, traded in the red during morning action, but rocketed into the pit close, which helped the broader market climb off its intraday low. The energy component spiked 5.7% to $48.55/bbl.
The stock market continued its rough week on Thursday with the S&P 500 (-0.9%) registering its fifth consecutive decline after failing to hold the 100-day moving average (2007). The price-weighted Dow Jones Industrial Average (-0.6%) fared a bit better while the Nasdaq Composite (-1.5%) and Russell 2000 (-1.7%) underperformed. Market participants were greeted by an astounding move in the foreign exchange market. Specifically, the Swiss franc was up as much as 25.0% against the dollar after the Swiss National Bank abandoned the EURCHF 1.20 floor and lowered the benchmark deposit rate to -0.75%. The move was likely taken in anticipation of a QE announcement from the ECB, and the dollar/franc pair was able to narrow its loss to 15.0% (0.8687); however, that was still large enough to resonate with investors who were lulled into a false sense of security by the SNB's pledge to maintain the exchange rate floor. Equity indices began the day with slim gains, but the morning strength faded alongside crude oil, which slid from a session high at $51.00/bbl to $46.57/bbl. The energy component ended the day lower by 4.1%, but that masked the fact that crude fell almost 9.0% from its best level of the day. Furthermore, that pullback was closely correlated with a broad-market slide, which was paced by cyclical sectors.
Next Week In View

Economic Commentaries
Jason's Commentaries
Market Call: FLAT to upside
Date: 24 Feb 2014
No comments:
Post a Comment