19 Feb 2014 AMC- Market ended winning streak as FOMC releases minutes.
Market Summary

European
Markets Closing Prices
European
markets are now closed; stock markets across Europe performed as follows:
·
UK's FTSE: 0.0%
·
Germany's DAX: 0.0%
·
France's CAC: + 0.2%
·
Spain's IBEX: + 0.1%
·
Portugal's PSI: -0.4%
·
Italy's MIB Index: -0.2%
·
Irish Ovrl Index: + 0.3%
·
Greece ATHEX Composite: -1.4%
Before Market Opens
S&P futures vs fair value:
-4.60. Nasdaq futures vs fair value: -6.30.
The S&P 500 futures have climbed off their lows, but remain almost five points below fair value.
Markets across Asia ended mostly higher. In China, SHIBOR slid to its lowest levels since May as rates continued normalizing following the Lunar New Year. Elsewhere, Australia released the latest CB Leading Index (0.8% month-over-month, 0.2% previous) and Wage Price Index (0.7% quarter-over-quarter versus 0.7% expected) readings. Also of note, Malaysia's inflation rate ticked up to 3.4% year-over-year (3.2% previous).
·
Japan's Nikkei fell 0.5% amid some profit-taking as the
yen strengthened. Real estate stocks were pressured as Sumitomo Realty &
Development lost 2.4% and Mitsui Fudosan shed 0.7%.
·
Hong
Kong's Hang Seng eked out a
small gain of 0.3%. Financials led as Bank of East Asia jumped 4.8% after
announcing record profit.
·
China's Shanghai Composite climbed 1.1% to its best
level in nine weeks. Coal-based China Shenhua Energy rallied 1.4% after
announcing an 18% year-over-year rise in coal production.
Major European indices trade lower
across the board with Italy's MIB (-0.6%) seeing the largest loss. Participants
received several economic data points. Great Britain's claimant count fell
27,600 (-20,000 forecast, -27,700 prior) and the unemployment rate ticked up to
7.2% from 7.1% (7.1% expected). Separately, average earnings index + bonus
increased 1.1% (1.0% consensus, 0.9% previous). Elsewhere, Spain's trade
deficit narrowed to EUR1.83 billion from EUR1.76 billion (deficit of EUR1.20
billion expected) and Swiss ZEW Expectations fell to 28.7 from 36.4 (40.0
expected).
In news, European Central Bank member Ewald Nowoty said the ECB is nearing an agreement to terminate sterilizing bond purchases completed under the Securities Markets Program.
In news, European Central Bank member Ewald Nowoty said the ECB is nearing an agreement to terminate sterilizing bond purchases completed under the Securities Markets Program.
·
In
France, the CAC is lower by
0.1%. Steelmaker Vallourec leads the decline with a loss of 4.7%. On the
upside, utilities Electricite de France GDF Suez outperform with respective
gains of 0.6% and 0.9%.
·
Germany's DAX trades down 0.2% with financials showing
weakness. Deutsche Bank and Commerzbank are lower by 0.8% and 2.7%,
respectively. Similar to France, utilities are showing strength with RWE
trading higher by 1.0%.
·
Great
Britain's FTSE holds a loss of
0.4% with health care displaying weakness. AstraZeneca and GlaxoSmithKline are
lower by 3.5% and 1.3%, respectively. Rolls Royce Holdings outperforms, trading
higher by 2.4%.
·
Italy's MIB sports a loss of 0.6% amid broad weakness.
Banco Popolare is lower by 2.9% and UniCredit trades down 1.4%.
Asia
·
Markets across Asia
ended mostly higher
·
China's SHIBOR slid to
its lowest levels since May as rates normalize following the Lunar New Year
·
Australia released the
latest CB Leading Index (0.8% MoM actual v. 0.2% MoM previous) and Wage Price
Index (0.7% QoQ actual v. 0.7% QoQ expected) readings
·
Malaysia's inflation
rate ticked up to 3.4% YoY (3.2% YoY previous)
·
Japan's Nikkei (-0.5%)
saw some profit-taking as the yen strengthened
·
Hong Kong's Hang Seng
(+0.3%) eked out a small gain
·
China's Shanghai
Composite (+1.1%) climbed to its best level in nine weeks
·
Australia's ASX (+0.3%)
advanced for the ninth time in ten sessions
Market Internals


Market Internals -Technical-
The Nasdaq closed down 35 (-0.82%) at 4238, the S&P 500 closed down 12 (-0.65%) at 1829, and the Dow closed down 90 (-0.56%) at 16041. Action came on slightly below average volume (NYSE 688 mln vs. avg. of 700; NASDAQ 1800 mln vs. avg. of 1853), with decliners outpacing advancers (NYSE 1113/2014, NASDAQ 739/1876) and new highs outpacing new lows (NYSE 162/15, NASDAQ 143/10).
Relative Strength:
Coffee-JO +10.13%, Volatility-VXX +6.61%, Natural Gas-UNG +2.86%, Sugar-SGG +1.96%, Agriculture-DBA +1.8%, Egypt-EGPT +0.71%, China 25 Index-FXI +0.5%, India-INP +0.32%, Indonesia-IDX +0.26%, Malaysia-EWM +0.13%.
Relative Weakness:
Junior Gold Miners-GDXJ -6.81%, Silver Miners-SIL -3.34%, Gold Miners-GDX -3.14%, Russia-RSX -2.96%, Eastern Europe-ESR -2.83%, Regional Banks-KRE -2.8%, Turkey-TUR -2.78%, Greece-GREK -2.69%, Banks-KBE -2.46%, Chile-ECH -2.14%.


Leaders and Laggards


Technical Updates


Briefing's Commentaries
Closing Market Summary: S&P 500
Snaps Three-Day Win Streak
Equities ended on their lows with the S&P 500 snapping its three-day win streak. The benchmark index fell 0.7% while the Nasdaq (-0.8%) lagged throughout the session.
Stocks began the day with slim losses, but the Dow and S&P 500 were quick to erase the early weakness. For its part, the Nasdaq was unable to make a sustained move into the green.
The S&P 500 climbed through the first hour of action, but the rally stalled with the index less than four points shy of its all-time intraday high of 1850.84. Shortly before midday, equities slumped to lows in a move that coincided with a headline from the International Monetary Fund reminding investors that global growth remains uneven and fragile with persistent downside risks.
While the IMF headline presented a convenient excuse for the swift dive, the stock market was challenged with increasing resistance prior to the release. The Nasdaq was bouncing up against its flat line while influential sectors like consumer discretionary (-0.9%), financials (-1.2%), and industrials (-0.9%) underperformed. Once the headline hit, the earlier underperformers drove the remainder of the market lower.
Eight of ten sectors ended in the red with financials registering the largest decline. Citigroup (C 48.19, -1.19) was the weakest performer among the majors while regional banks also endured significant losses. The SPDR S&P Regional Banking ETF (KRE 37.83, -1.09) fell 2.8%.
Elsewhere, the discretionary sector slumped despite some M&A activity among luxury retailers. Signet Jewelers (SIG 93.65, +14.38) spiked 18.1% after announcing an agreement to acquire Zale (ZLC 20.92, +6.01) for $21 per share, representing a 41.0% premium to Tuesday's closing price.
Also of note, the industrial sector was pressured by transports as The Dow Jones Transportation Average saw its second day of losses. The bellwether complex lost 1.3% and finished the session down 2.3% for the week.
On the upside, energy and telecom services added 0.1% and 0.5%, respectively.
Treasuries finished on their lows (10-yr yield +2 bps at 2.73%) with the bulk of the retreat coming after the release of the FOMC minutes from the January meeting. Although the minutes did not contain any major surprises, they did indicate that some officials said there should be a ‘clear presumption' in support of continued tapering in $10 billion increments.
Participation was on the light side with 688 million shares changing hands on the floor of the New York Stock Exchange.
Today's economic data included two reports:
·
Housing starts fell 16%
in January, from an upwardly revised 1.048 million (from 999,000) in December
to 880,000. The Briefing.com consensus expected housing starts to fall to
963,000. There are some questions about how much of a role the adverse weather
played in the decline. Surely the 67.7% decline in starts in the Midwest was
partially weather driven. However, starts in the South, which was not that
affected by the polar vortex, declined 12.5% in January. Furthermore, the
hard-hit Northeast saw starts increase 61.9% in January. Normally, an exogenous
shock -- such as the weather -- would result in a sizable rebound in the next
month or two. However, after looking at all of the regional data, it is
difficult to state with assurance that starts will return to the 1.00 million
trend that they averaged in November and December.
·
January PPI increased
0.2% after ticking up 0.1% in December. The Briefing.com consensus expected the
PPI to increase 0.2%. The BLS reconstructed the PPI index for January. Instead
of using a Stage-of-Processing method, the PPI is now calculated based on a
Final Demand-Intermediate Demand system. Beyond the typical manufacturing data,
the new index also includes price trends for services, government spending, and
exports. Prices of final demand goods increased 0.4% in January after
increasing by the same amount in December. Energy price growth softened, up
0.3% in January after increasing 1.5% in December. Much of the gain in the
final demand goods index was due to a 2.7% increase in pharmaceutical
preparations.
Tomorrow, weekly initial claims and
January CPI will be reported at 8:30 ET while January Leading Indicators and
the Philadelphia Fed survey for February will both be released at 10:00 ET.
·
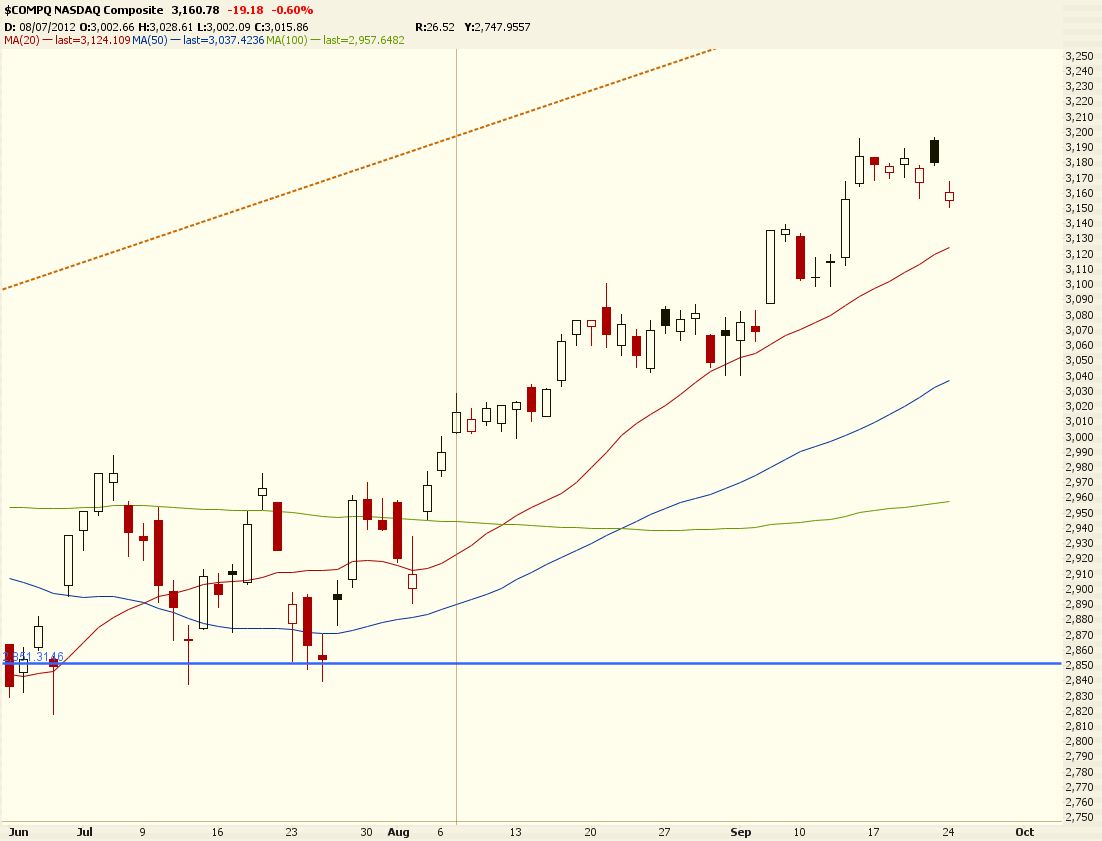
Nasdaq Composite +2.6%
YTD
·
Russell 2000 -1.1%
YTD
·
S&P 500 -1.1%
YTD
·
Dow Jones Industrial
Average -3.2% YTD
Commodities
Closing Commodities: Natural Gas
Closes 11% Higher
·
Mar natural gas extended
yesterday's gains on forecasts calling for frigid weather at the end of Feb and
heading into early March. Prices lifted from a session low of $5.83 per MMBtu
and rose as high as $6.28 per MMBtu, a new high since Jan 2009 for the
continuous contract.
·
Natural gas pulled back
slightly in the last half hour of pit trade and settled with a solid 11.0% gain
at $6.15 per MMBtu.
·
Mar crude oil was higher
today despite a slightly stronger dollar index. Prices dipped to a session low
of $102.40 per barrel but quickly regained momentum. The energy component
pushed to a high of $103.47 per barrel, its highest level since Oct, as it headed
into the close and settled at $103.46 per barrel, or 0.9% higher.
·
Apr gold traded in
negative territory ahead of the release of FOMC minutes at 14:00 ET. The yellow
metal brushed a session low of $1317.50 per ounce in early afternoon pit trade
and settled 0.3% lower at $1320.60 per ounce, booking its first loss in eight
sessions.
·
Mar silver chopped
around in the red for most of today's floor trade. It touched a session high of
$21.92 per ounce in morning action but quickly slipped back below the unchanged
line. It eventually settled at $21.85 per ounce, or 0.2% lower.
·
Both of the precious
metals slipped further into the red in electronic trade following the release
of the FOMC minutes. Gold is now down 0.7% at $1314.70 per ounce while silver
is down 1.2% at $21.64 per ounce.
CBOT
Agriculture and Ethanol/ICE Sugar Closing Prices
·
Mar
corn rose 4 cents to
$4.54/bushel
·
Mar
wheat rose 8 cents to
$6.20/bushel
·
Mar
soybeans fell 6 cents to
$13.55/bushel
·
Mar
ethanol rose 1 cent to
$2.10/gallon
·
May
sugar (#16 (U.S.)) rose 0.06
of a penny to 21.83 cents/lbs
NYMEX
Energy Closing Prices
Mar crude oil rose $0.94 to $103.46/barrel
·
Crude oil was higher
today despite a slightly stronger dollar index. Prices dipped to a session low
of $102.40 in morning action but quickly regained momentum. The energy
component pushed to a high of $103.47, its highest level since Oct, as it
headed into the close and settled just below that level with a 0.9% gain.
Mar natural gas rose 61 cents $6.15/MMBtu
·
Natural gas extended
yesterday's gains as forecasts call for frigid weather at the end of Feb and
heading into early March. Prices lifted from a session low of $5.83 and rose as
high as $6.28, a new high since Jan 2009 for the continuous contract. Natural
gas pulled back slightly in the last half hour of pit trade and settled with a
solid 11.0% gain.
Mar heating oil rose 4 cents to $3.14/gallon
Mar
RBOB fell 2 cents to $2.82/gallon
Treasuries
Treasuries Reverse to Losses: 10-yr:
-07/32..2.735%..USD/JPY: 102.25..EUR/USD: 1.3735
·
Treasuries closed on
their lows, giving up their early gains. Click here to see an intraday
yields chart.
·
The complex saw modest
overnight gains persist into early U.S. trade, but sellers managed to gain the
upper hand after this morning's disappointing housing starts (880K
actual v. 963K expected) and building permits (937K actual v. 980K expected)
data failed to ignite another round of buying.
·
The
lack of a follow through bid following the disappointing housing data was
pinned on positioning as data suggested
participants were rather long duration.
·
Maturities pressed to
their worst levels of the day following the release of the latest FOMC
minutes, which suggested the economy continues to expand at a moderate pace,
and hinted the Committee may alter its forward guidance as the unemployment
rate approaches 6.5%.
·
Today's selling
had the biggest impact on the belly of the curve.
·
The 5y added +3.3bps to
finish @ 1.512% after seeing an early test of 1.450% support.
·
The 10y tacked on
+2.3bps to end today's trade @ 2.734%. Action in the benchmark yield settled
just shy of 2.750% resistance and the 100 dma (2.746%).
·
A
slightly flatter curve developed as the 2-10
·
-yr
spread narrowed to 241.5bps.
·
Precious metals slid as
gold fell -$10 to $$1314 and silver lost -$0.25 to near $$21.65.
·
Data: Initial and continuing claims, CPI (8:30),
Philly Fed, and leading indicators (10).
Next Day In View

Economic Commentary
Economic Summary: PPI in line with
expectations; Housing Starts miss expectations; FOMC members agree on measured
tapering; CPI, and Philly Fed due out tomorrow
Economic Data Summary:
Economic Data Summary:
·
January
Housing Starts 888K vs Briefing.com consensus of 963K; December was revised to
1.048 M from 999K
·
January Building Permits
937K vs Briefing.com consensus of 980K; December was revised to 991K from 986K
o There are some questions about how much of
a role the adverse weather played in the decline. Surely the 67.7% decline in
starts in the Midwest was partially weather driven. However, starts in the
South, which was not that affected by the polar vortex, declined 12.5% in
January. Furthermore, the hard-hit Northeast saw starts increase 61.9% in
January. Normally, an exogenous shock -- such as the weather -- would result in
a sizable rebound in the next month or two.
·
January
PPI 0.2% vs Briefing.com consensus of 0.2%; December was revised to 0.1% from
0.1%
·
January Core PPI 0.2% vs
Briefing.com consensus of 0.1%; December was revised to 0.2% from 0.3%
o The BLS reconstructed the PPI index for
January. Instead of using a Stage-of-Processing method, the PPI is now
calculated based on a Final Demand-Intermediate Demand system. Beyond the
typical manufacturing data, the new index also includes price trends for
services, government spending, and exports. For more information, please read
our Economic Insight "A Big Change at Hand for the Calculation of the
PPI." Prices of final demand goods increased 0.4% in January after
increasing by the same amount in December. Energy price growth softened, up
0.3% in January after increasing 1.5% in December. Much of the gain in the
final demand goods index was due to a 2.7% increase in pharmaceutical
preparations.
Fed/Treasury Events Summary:
·
FOMC Minutes Summary:
o In their discussion of the economic situation
and the outlook, participants generally noted that economic activity had
strengthened more in the second half of 2013 than they had expected at the time
of the December meeting. In particular, consumer spending had strengthened, and
business investment appeared to be on a more solid uptrend.
o In their discussion of monetary policy in the
period ahead, all members agreed that the cumulative improvement in
labor market conditions and the likelihood of continuing improvement indicated
that it would be appropriate to make a further measured reduction in the pace
of its asset purchases at this meeting.
In considering forward guidance about the target federal funds rate, all members agreed to retain the thresholds-based language employed in recent statements.
In considering forward guidance about the target federal funds rate, all members agreed to retain the thresholds-based language employed in recent statements.
o In addition, the Committee decided to repeat the
qualitative guidance, introduced in December, clarifying that a range of labor
market indicators would be used when assessing the appropriate stance of policy
once the unemployment rate threshold had been crossed.
Upcoming Economic Data:
·
Weekly Initial Claims
due out Thursday at 8:30 (Briefing.com consensus of 335K; Last Week was 339K)
·
Weekly Continuing Clams
due out Thursday at 8:30 (Briefing.com consensus of 2.973 M ; Last Week was
2.953 M )
·
January
CPI due out Thursday at 8:30 (Briefing.com consensus of 0.2%; December was
0.3%)
·
January
Core CPI due out Thursday at 8:30 (Briefing.com consensus of 0.1%; December was
0.1%)
·
February
Philadelphia Fed due out Thursday at 10:00 (Briefing.com consensus of 7.4;
January was 9.4)
·
January Leading
Indicators due out Thursday at 10:00 (Briefing.com consensus of 0.4%; December
was 0.1%)
Upcoming Fed/Treasury Events:
·
Saint Louis Fed
President (non a voting FOMC member, typically dovish) to speak Friday at 13:10
Other International Events of
Interest
·
Britain's claimant count
change came out at -27.6K (-18.3K expected) and the unemployment rate ticked up
to 7.2% (7.1% previous)
On other news....
Fed FOMC minutes exerpts
Staff Review of the Economic Situation
Staff Review of the Economic Situation
·
Overall, labor market
indicators appeared consistent with a gradual ongoing improvement in labor
market conditions. Manufacturing production increased at a robust pace in
the fourth quarter, with broad-based gains across industries. The pace of
activity in the housing sector showed some tentative signs of stabilizing, as
the effects of the past year's rise in mortgage rates appeared to wane.
Participants' Views on Current
Conditions and the Economic Outlook:
·
In their discussion of
the economic situation and the outlook, participants generally noted that
economic activity had strengthened more in the second half of 2013 than they
had expected at the time of the December meeting. In particular, consumer
spending had strengthened, and business investment appeared to be on a more
solid uptrend.
·
Participants agreed
that, with the unemployment rate approaching 6-1/2 percent, it would soon
be appropriate for the Committee to change its forward guidance in order to
provide information about its decisions regarding the federal funds rate after
that threshold was crossed. A range of views was expressed about the form that
such forward guidance might take. Some participants favored quantitative
guidance along the lines of the existing thresholds, while others preferred a
qualitative approach that would provide additional information regarding the
factors that would guide the Committee's policy decisions. Several participants
suggested that risks to financial stability should appear more explicitly in
the list of factors that would guide decisions about the federal funds rate
once the unemployment rate threshold is crossed, and several participants
argued that the forward guidance should give greater emphasis to the
Committee's willingness to keep rates low if inflation were to remain
persistently below the Committee's 2 percent longer-run objective. Additional
proposals included relying to a greater extent on the Summary of Economic
Projections as a communications device and including in the guidance an
indication of the Committee's willingness to adjust policy to lean against
undesired changes in financial conditions.
·
A few participants
raised the possibility that it might be appropriate to increase the federal
funds rate relatively soon.
Committee Policy Action
·
Committee members saw
the information received over the intermeeting period as indicating that growth
in economic activity had picked up in recent quarters. Labor market indicators
were mixed but on balance showed further improvement. In their discussion
of monetary policy in the period ahead, all members agreed that the cumulative
improvement in labor market conditions and the likelihood of continuing
improvement indicated that it would be appropriate to make a further measured
reduction in the pace of its asset purchases at this meeting.
·
In considering forward
guidance about the target federal funds rate, all members agreed to retain the
thresholds-based language employed in recent statements. In addition, the
Committee decided to repeat the qualitative guidance, introduced in December,
clarifying that a range of labor market indicators would be used when assessing
the appropriate stance of policy once the unemployment rate threshold had been
crossed.
Currencies
Dollar Ticks Higher on FOMC Minutes:
10-yr: -06/32..2.731%..USD/JPY: 102.41..EUR/USD: 1.3737
·
The Dollar Index climbed
to session highs near 80.20 following the release of the latest FOMC minutes. Click here to see a daily Dollar
Index chart.
·
The minutes suggested the
U.S. economy continues to strengthen at a moderate pace, and discussed the
possibility of the Committee altering its forward guidance as the unemployment
rate approaches the 6.5% threshold.
·
EURUSD is -20 pips @ 1.3735 as trade presses session
lows. The pair held little changed ahead of the FOMC minutes before sellers
took control following the release. Participants will continue to view the
1.3700 area as support into tomorrow's release of Flash Manufacturing and
Services PMI data from across the region.
·
GBPUSD is +5 pips @ 1.6685 as action hovers little
changed. Sterling ran into some early selling following this morning's uptick
in the unemployment rate to 7.2% (7.1% previous), but saw a steady bid
throughout much of U.S. trade erase those losses. Near-term support rests in
the 1.6600 area. Britain's CBI Industrial Orders are due out tomorrow.
·
USDCHF is +20 pips @ .8890 as buyers take control for
the first time in five days. Early selling dropped action to its lowest levels
of 2014 (.8855), but trade has reversed course and is now pressing the highs.
The first level of resistance rests at .8940.
·
USDJPY is +5 pips @ 102.40 as trade tests session
highs. A quiet day for news and data out of Japan has seen trade trapped in the
102.00/102.50 region.
·
AUDUSD is -30 pips @ .8995 as sellers have taken
control following the FOMC minutes. The recent selling has dropped the hard
currency to its lowest level in three days, and has turned focus towards .8950
support. China's HSBC Flash Manufacturing PMI will cross the wires
tonight.
·
USDCAD is +130 pips @ 1.1075 as today's bid has erased
10 days of action. The pair has been aided by Canada's disappointing
wholesale sales (-1.4% MoM actual v. -0.5% MoM expected) and
Canadian Natural Resources' $2.8 bln acquisition of Devon Energy natural gas
assets.
Jason's Commentaries
Got it right on last night's call. Market was at the high and the FOMC minutes gave the market a perfect reason to profit take. Although the FOMC minutes came in expected, the market reacted in a negative fashion. The market started last night with a bullish bias which covered the bearish gap. However, the bullish bias was being dragged down by Nasdaq which subsequently broke the streak by 12pm ET. Volumes were at 702.3.m shares traded on the NYSE and the bears are winning the bulls by 2:1. The Financials and the industrials were the 2 worst performer in the session last night. Financials lost 1.38%, while the industrial lost 0.94%. Not exactly good to see 2 of the most important sector leading the lost. On the technical perspective, we' re have bearish candlesticks pattern at the resistance lines and we're likely continue the short retracement. Yellen's speech was being cancelled once again and Yellen will not be testifying in front of Congress today. Stay safe for this volatile period =D
Market Call: DOWN
Date: 20 Feb 2014
No comments:
Post a Comment