3 April 2014 AMC- Market retraced ahead of employment data
Market Summary

European
Markets Closing Prices
European
markets are now closed; stock markets across Europe performed as follows:
·
UK's FTSE: -0.2%
·
Germany's DAX: + 0.1%
·
France's CAC: + 0.4%
·
Spain's IBEX: + 1.4%
·
Portugal's PSI: + 0.4%
·
Italy's MIB Index: + 1.4%
·
Irish Ovrl Index: -0.3%
·
Greece ATHEX Composite: -2.2%
Before Market Opens
S&P futures vs fair value:
-1.20. Nasdaq futures vs fair value: -4.50.
The S&P 500 futures trade one point below fair value.
Asian markets ended on mixed note after Chinese officials announced a stimulus program that aims to boost infrastructure spending while also providing support to low-income housing and small businesses.
Participants received several data points. China's Non-Manufacturing PMI slipped to 54.5 from 55.0 while HSBC Services PMI improved to 51.9 from 51.0. Japan's foreign bonds buying report pointed to net sales in the amount of JPY763.60 billion (previous sales of JPY398.70 billion). Hong Kong's Manufacturing PMI fell to 49.90 from 53.30. India's HSBC Services PMI fell to 47.5 from 48.8. Australia's trade surplus narrowed to $1.20 billion from $1.39 billion (expected surplus of $850 million) as imports increased 1.0% month-over-month (prior 1.0%) while exports were unchanged (prior 4.0%). Separately, AIG Services Index fell to 48.9 from 55.2.
·
Japan's Nikkei gained 0.8%, receiving support from
growth-sensitive names. COMSYS Holdings jumped 3.7% and Mitsui Engineering
& Shipbuilding rose 2.3%.
·
Hong
Kong's Hang Seng added 0.2%,
settling near its session lows as property names weighed. China Resources Land,
China Overseas Land, and Sino Land fell between 1.0% and 2.6%. On the upside,
Lenovo Group gained 1.8% and Want Want China Holdings jumped 2.4%.
·
China's Shanghai Composite fell 0.7% after being
pressured by real estate names. Tianjin Reality Development, Beijing Huaye
Realestate, and Beijing Vantone Real Estate lost between 5.6% and 9.2%.
Core European indices trade little
changed while peripheral markets outperform with Spain's IBEX (+0.8%) in the
lead. In economic data, the European Central Bank left its key interest rate
unchanged at 0.25%, as expected. Separately, Retail Sales rose 0.4%
month-over-month (consensus -0.6%, prior 1.0%) and Services PMI slipped to 52.2
from 52.4 (expected 52.4). Germany's Services PMI fell to 53.0 from 54.0
(forecast 54.0). Great Britain's Services PMI fell to 57.6 from 58.2 (consensus
58.1) while Housing Equity Withdrawals reached GBP10.60 billion
quarter-over-quarter (expected GBP9.40 billion, prior GBP10.60 billion).
France's Services PMI ticked up to 51.5 from 51.4 (consensus 51.4). Italy's
Services PMI fell to 49.5 from 52.9 (expected 52.0). Spain's Services PMI
improved to 54.0 from 53.7 (forecast 53.5).
·
Germany's DAX is flat. Industrial names lag with Deutsche
Lufthansa and Deutsche Post both down near 0.9%. Health care names outperform
as Fresenius Medical Care and Henkel display respective gains of 0.8% and
0.3%.
·
Great
Britain's FTSE is flat. British
Sky Broadcasting is the weakest performer, down 2.5% after receiving a
downgrade at HSBC. Miners also lag with Anglo American, Antofagasta, and Rio
Tinto down between 1.5% and 2.2%.
·
France's CAC is higher by 0.1% as steelmaker
ArcelorMittal leads with a gain of 0.8%. On the downside, utilities Electricite
de France, GDF Suez, and Veolia Environnement hold losses between 0.9% and
2.2%.
·
Spain's IBEX trades higher by 0.8%. Financials BBVA,
Bankia, and Banco Popular Espanol lead with gains between 1.0% and 1.2%.
U.S. Equities
·
Futures point to little
change at the open
·
Yesterday's bid ran the
S&P 500 to a record-high close while the DJIA finished within a handful of
points of its own record peak
·
The Nasdaq sits ~2.0%
off its best level in 15 years
·
Challenger Job Cuts
(-30.2%)
·
Initial Claims (326K
actual v. 320K expected)
·
Continuing Claims (2836K
actual v. 2850K expected)
·
Trade Balance (-$42.3B
actual v. -$39.3B expected)
o S&P Futures +1 @ 1884
o Dow Futures +9 @ 16,496
o Nasdaq Futures -1 @ 3657
Asia
·
Markets finished mixed
across Asia
·
Japan's Nikkei (+0.8%)
rallied as the yen slipped to a two and a half-month low below 104 against the
dollar
·
China's Shanghai
Composite (-0.7%) lost ground after Non-Manufacturing PMI eased to 54.5 (55.0
previous). Beijing announced stimulus measures targeting railroads and low
income housing, but the announcement failed to inspire investors
·
Hong Kong's Hang Seng
(+0.2%) eked out a small gain to close at its best level in nearly a month
·
India's Sensex (-0.2%)
failed to see a record-high close for the first time in eight days
Market Internals


Market Internals -Technical-
The Nasdaq closed down 39 (-0.91%) at 4238, the S&P 500 closed down 2 (-0.11%) at 1889, and the Dow flat at 16573. Action came on below average volume (NYSE 647 mln vs. avg. of 7313; NASDAQ 1915 mln vs. avg. of 2022), with decliners outpacing advancers (NYSE 1261/1836, NASDAQ 789/1848) and new highs outpacing new lows (NYSE 161/7, NASDAQ 104/21).
Relative Strength:
Coffee-JO +1.87%, Natural Gas-UNG +1.65%, Turkey-TUR +1.38%, Sugar-SGG +1.36%, Gasoline-UGA +1.26%, Corn-CORN +1.14%, Spain-EWP +1.04%, Italy-EWI +1.02%, Singapore-EWS +0.46%, Austria-EWO +0.30%.
Relative Weakness:
Biotechnology-XBI -3.62%, Social Media-SOCL -3.41%, Biotechnology-IBB -2.85%, Internet Composite-FDN -2.48%, Junior Gold Miners-GDXJ -2.38%, India-INP -2.07%, Eastern Europe-ESR -1.84%, Greece-GREK -1.80%, Middle East and Africa-GAF -1.77%, Vietnam-VNM -1.75%.


Leaders and Laggards


Technical Updates


Briefing's Commentaries
Closing Market Summary: Biotech and
Momentum Names Lead Stocks Lower
The stock market finished the Thursday session on a lower note with small caps leading the weakness. The Russell 2000 (-1.0%) and Nasdaq (-0.9%) posted comparable losses while the Dow Jones Industrial Average (unch) and S&P 500 (-0.1%) finished little changed after climbing off their lows during the last hour of action.
Equity indices began the day with modest gains, but were quick to slip into the red, where they remained for the rest of the session. Of the major averages, the Nasdaq faced the most aggressive selling due to the daylong weakness in biotechnology and an afternoon slump in the technology sector (-0.6%).
Biotechnology spent the entire session in a steady retreat that pressured the iShares Nasdaq Biotechnology ETF (IBB 234.71, -6.89) back below its 100-day moving average (238.12). The biotech ETF lost 2.9% while the broader health care sector lost 0.3%.
For its part, the technology sector was among the early relative strength leaders before turning into a laggard during the early afternoon. It is worth mentioning the early strength was bolstered by a big gain in Google (GOOG 569.74, +2.74), which underwent a 2:1 split. The stock was up more than 3.0% in the morning before surrendering most of its gain over the course of the session. Most other large tech names finished in the red while Intel (INTC 26.41, +0.52) held a solid gain throughout the day.
Elsewhere, the discretionary sector (-0.5%) was another notable laggard after finishing among the leaders on Monday and Tuesday. Large components like Amazon.com (AMZN 333.62, -8.34), Priceline.com (PCLN 1237.45, -29.21), and Netflix (NFLX 354.69, -8.19) fell between 2.3% and 2.4% while homebuilders held up relatively well. The iShares Dow Jones US Home Construction ETF (ITB 24.71, 0.00) ended flat.
On the upside, the energy sector (+0.6%) held a solid gain throughout the session while crude oil advanced 0.7% to $100.29/bbl.
Meanwhile, the other commodity-linked sector, materials (+0.1%) posted a modest gain, thanks to a boost from Monsanto (MON 117.04, +2.62), which gained 2.3% after being upgraded to ‘Overweight' from ‘Neutral' at JP Morgan.
Treasuries ended near the middle of their range with the benchmark 10-yr yield falling two basis points to 2.79%.
Participation was below average with 647 million shares changing hands at the NYSE.
Today's economic data included three reports:
·
The weekly initial
claims level increased to 326,000 from a revised 310,000 (from 311,000). The
Briefing.com consensus expected the initial claims level to increase to
320,000. After several months between 330,000 and 340,000, initial claims have
broken those bounds and are now trending between 315,000 and 330,000. This
range is more typical of a 200,000 monthly increase in nonfarm payrolls. We
would not be surprised, given the strength of the claims data in March, if payrolls
top 200,000 for the first time since November 2013.
·
The U.S. trade deficit
increased to $42.30 billion in February from a slightly upwardly revised $39.30
billion (from $39.10 billion) in January. That was the largest deficit since
reaching $43.40 billion in September 2013. The Briefing.com consensus pegged
the trade deficit at $39.30 billion. The goods deficit rose to $61.70 billion
in February from $59.50 in January, an increase of $2.20 billion. The services
surplus fell $800 million to $19.40 billion in February from $20.20
billion.
·
The ISM
Non-Manufacturing Index increased to 53.1 in March from 51.6 in February while
the Briefing.com consensus expected an increase to 53.5. The increase in the
headline index was mostly the result of a recovery in employment. The
Employment Index, which contracted in February, increased to 53.6 in March from
47.5.
Tomorrow's data will focus on jobs
with March Nonfarm Payrolls (Briefing.com consensus 195K), Private Payrolls
(consensus 205K), Unemployment Rate (consensus 6.6%), Hourly Earnings
(consensus +0.2%), and Average Workweek (consensus 34.4) all set to cross the
wires at 8:30 ET.
·
S&P 500 +2.2%
YTD
·
Russell 2000 +1.6%
YTD
·
Nasdaq Composite +1.5%
YTD
·
Dow Jones Industrial
Average -0.02% YTD
Commodities
Closing Commodities: Natural Gas
Gains 2.5%, Precious Metals End Lower
·
Precious metals traded
lower today as a stronger dollar index weighed on prices.
·
June gold brushed a
session low of $1281.90 per ounce in early morning action and settled with a
0.5% loss at $1284.60 per ounce.
·
May silver dipped to a
session low of $19.66 per ounce shortly after floor trade opened. It then
consolidated near the $19.85 per ounce level and eventually settled 1.3% lower
at $19.79 per ounce.
·
May crude oil lifted
from its session low of $99.22 per barrel and broke into positive territory by
late morning pit action. It brushed a session high of $100.34 per barrel and
settled at $100.29 per barrel, booking a gain of 0.7%.
·
May natural gas fell to
a session low of $4.36 per MMBtu following inventory data that showed a draw of
74 bcf when a draw of 74-75 bcf was anticipated. However, it quickly regained
momentum and climbed to a session high of $4.48 per MMBtu before settling with
a 2.5% gain at $4.47 per MMBtu.
COMEX
Metals Closing Prices
June gold fell $6.20 to $1284.60/oz
·
Gold traded lower today
as a stronger dollar index weighed on prices. The yellow metal brushed a
session low of $1281.90 in early morning action and settled with a 0.5%
loss.
May silver fell $0.27 to $19.79/oz
·
Silver also spent pit
trade in negative territory, with prices dipping as low as $19.66 shortly after
floor trade opened. It then consolidated near the $19.85 level and eventually
settled 1.3% lower.
May
copper fell 2 cents to $3.03/lbs
CBOT
Agriculture and Ethanol/ICE Sugar Closing Prices
·
May
corn rose 4 cents to
$5.00/bushel
·
May
wheat rose 7 cents to
$6.75/bushel
·
May
soybeans rose 12 cents to
$14.74/bushel
·
May
ethanol fell 19 cents to
$2.31/gallon
·
May
sugar (#16 (U.S.)) rose 1.05
of a penny to 23.58 cents/lbs
NYMEX
Energy Closing Prices
May crude oil rose $0.66 to $100.29/barrel
·
Crude oil lifted from
its session low of $99.22 and broke into positive territory by late morning pit
action. It brushed a session high of $100.34 and settled just below that level,
booking a gain of 0.7%.
May natural gas rose 11 cents to $4.47/MMBtu
·
Natural gas fell to a
session low of $4.36 following inventory data that showed a draw of 74 bcf when
a draw of 74-75 bcf was anticipated. However, it quickly regained momentum and
climbed to a session high of $4.48 before settling with a 2.5% gain.
May heating oil rose 4 cents to $2.91/gallon
May
RBOB rose 4 cents to $2.91/gallon
Treasuries
Treasuries See First Gain in Five
Days: 10-yr: +03/32..2.790%..USD/JPY: 103.90..EUR/USD: 1.3713
·
Treasuries ended just
off session highs as buyers took control for the first time in five
days. Click here to see an intraday
yields chart.
·
The complex hovered
little changed into the start of U.S. trade and saw little reaction to the
mixed initial (326K actual v. 320K expected) and continuing (2836K actual v.
2850K expected) claims and larger than expected trade deficit (-$42.3B
actual v. -$39.3B expected).
·
Maturities chopped
around their breakeven lines ahead of the disappointing ISM Services (53.1
actual v. 53.5 expected) data before climbing to their best levels of the day
following the miss.
·
Trade spent the
remainder of the session drifting near the highs as traders positioned
themselves for tomorrow's nonfarm payroll report.
·
Outperformance
was seen at the long end as
the 30y shed -2.4bps to 3.625%. Today's bid dropped the 30y off trendline
resistance near 3.650% that is defended by the 50 dma. The 3.550% level remains
critical on the downside.
·
The 10y fell -1.3bps to
2.790% amid a rather muted trade. Action was confined to a 2.5bp range as bulls
were unable to push the benchmark yield back below its 100 dma (2.781%).
·
The 5y slipped -0.6bps
to 1.788%. Today's buying dropped the yield off its highest level in
seven months, but action remained above important trendline resistance in
the 1.725% area.
·
Curve
flattening persisted as the 5-30-yr spread tightened to 183.5bps.
·
Precious metals ended in
the red with gold -$5 @ $1286 and silver -$0.23 @ $19.82.
·
Data: Nonfarm payrolls, nonfarm private payrolls,
unemployment rate, hourly earnings, and average workweek (8:30).
Next Day In View

Economic Commentary
Economic Summary: February Trade
Balance wider than expected; ISM Services slightly misses the mark; NFP's
tomorrow at 8:30
Economic Data Summary:
Economic Data Summary:
·
March Challenger Job
Cuts -30.2% (February was -24%)
·
Weekly Initial Claims
326K vs Briefing.com consensus of 320K; Last Week was revised to 310K from 311K
·
Weekly Continuing Claims
2.836 M vs Briefing.com consensus of 2.85 M; Last Week was revised to 2.814 M
from 2.823 M
o The Briefing.com consensus expected the initial
claims level to increase to 320,000. After several months between 330,000 and
340,000, the initial claims have broken those bounds and are now trending
between 315,000 and 330,000. This range is more typical of a 200,000 monthly
increase in nonfarm payrolls.
·
February
Trade Balance -$42.3 bln vs Briefing.com consensus of -$39.5 bln; January was
revised to -$39.3 bln from -$39.1 bln
o The increase in the trade deficit should
not have been that big of a surprise. Exports in January were highly reliant
upon a large increase in sales of nonmonetary gold. Gold typically trades in an
up-and-down pattern, and a large increase in one month is normally followed by
a similarly large decrease the next. That was exactly what happened in
February. Nonmonetary gold exports fell by $1.2 bln in February after it
boosted exports by $1.8 bln in January. Overall, exports fell by $2.0 bln in
February to $190.4 bln. Petroleum-based exports declined by $1.2 bln.
·
March
ISM Services 53.1 vs Briefing.com consensus of 53.5; February was 51.6
o The Employment Index, which contracted in
February, increased to 53.6 in March from 47.5. Business activities/production
levels softened a bit as the related index fell from 54.6 in February to 53.4
in March. The drop in production was strange considering new orders firmed
(53.4 in March from 51.3 in February) and backlogs softened (51.5 from 52.0).
Normally, a decrease in production combined with an increase in orders would
result in an increase in order backlogs.
Upcoming Economic Data:
·
March
Nonfarm Payrolls due out Friday at 8:30 (Briefing.com consensus of 195K;
February was 175K)
·
March Nonfarm Private
Payrolls due out Friday at 8:30 (Briefing.com consensus of 205K; February was
162K)
·
March
Unemployment Rate due out Friday at 8:30 (Briefing.com consensus of 6.6%;
February was 6.7%)
·
March Hourly Earnings
due out Friday at 8:30 (Briefing.com consensus of 0.2%; February was 0.4%)
·
March Average Workweek
due out Friday at 8:30 (Briefing.com consensus of 34.4%; February was 34.2)
Other International Events of
Interest
·
China's Shanghai
Composite (-0.7%) lost ground after Non-Manufacturing PMI eased to 54.5 (55.0
previous). Beijing announced stimulus measures targeting railroads and low income
housing, but the announcement failed to inspire invest
On other news....
Currencies
Dollar
Tests 80.50 Resistance: 10-yr: +04/32..2.786%..USD/JPY: 103.95..EUR/USD: 1.3712
The Dollar Index tests key resistance in the 80.50 area as buyers remain
in control for a second session. Click here to see a daily Dollar
Index chart.
EURUSD is -50 pips @ 1.3715 after the European
Central Bank held its key rate unchanged at 0.25%, as expected. The
single currency whipped around in the moments following the decision, but has
seen steady in response to Mario Draghi's accompanying press conference
as he suggested a QE-type program was discussed and that the exchange rate is
critical for price stability. Support in the 1.3700/1.3750 area
remains in focus. Eurozone data out tomorrow is limited to German factory
orders.
GBPUSD is -40 pips @ 1.6585 as selling persists for a third
day. Today's weakness comes after Britain's Service PMI missed estimates and a Bank
of England Credit Conditions survey showed lenders are anticipating a jump in
loan demand heading into the back half of the year. Current action has
sterling probing the 50 dma with a breakdown putting the 1.6500 level in play.
Britain's Halifax PMI is due out tomorrow.
USDCHF is +45 pips @ .8910 as trade readies for its
best close in one and a half months. The pair hovered little changed
into the ECB rate decision, but started to gain momentum as the euro weakened.
Buying has ran action above the 50 dma (.8881), setting up a test of resistance
in the .8950 area that is guarded by the 100 dma.
USDJPY is +10 pips @ 103.95 as buyers remain in control for
a sixth day. The current win streak has run the pair to its best level
in two and a half months, and has trade testing key 104.00 resistance. A
breakout through the level puts the five and a half year highs in the 105.25
area back in play.
AUDUSD is -25 pips @ .9220 as trade slips off four
and a half-month highs. Selling in the hard currency comes following
downtick in China's Non-Manufacturing PMI and amid today's flight out of risk
assets.
USDCAD is
little changed near 1.1030 as action probes support in the area. The pair saw
some early selling following the larger than expected Canadian trade surplus
(CAD0.3 bln actual v. CAD0.2 bln expected), but once again saw buyers emerge in
support of the 1.1000 level. Tomorrow, Canadian data is heavy as employment
change, unemployment rate, and Ivey PMI are scheduled for release.Jason's Commentaries
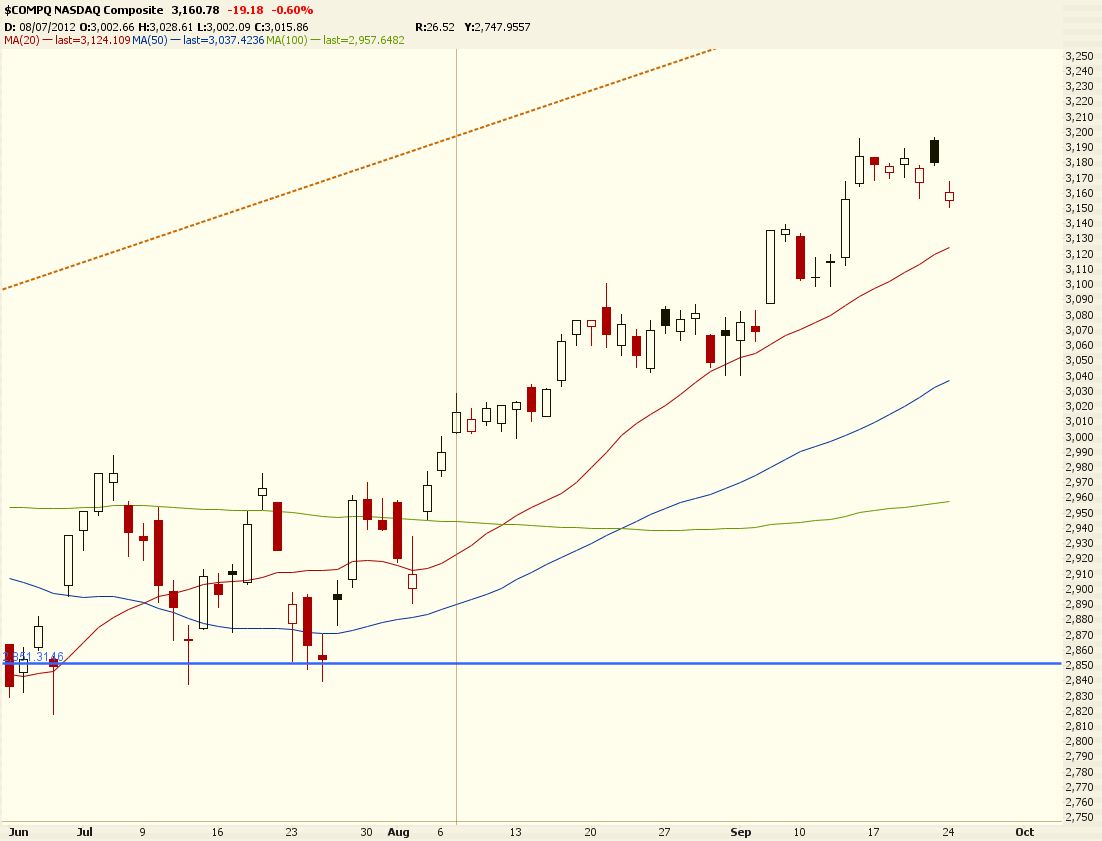
As expected, the market held flat to the downside ahead of the employment data. The retracement was being led by both Russells and Nasdaq. Volumes were at 660.6m shares traded on the NYSE, the rest of the internals were all pointing to a flat day. Of which, the discretionary and technology sector was the main laggard of the session however Energy sector made quite a bit of gain to offset the weigh from the other 2 sectors. Oracle and HP both lost more tha 1.8% which caused quite a bit of drag in the market. On the technical perspective, both Russells and Nasdaq hit my resistance lines nicely and forming a retracement. Since the ADP private data released at 191k jobs, the non farm payrolls are likely to hit above that number. If the number is below 191k jobs on the NFP, i reckon we might sunk.
A post by Charles Schwab on high frequency trading
high-frequency trading has run amok and is corrupting our capital market system by creating an unleveled playing field for individual investors and driving the wrong incentives for our commodity and equities exchanges. The primary principle behind our markets has always been that no one should carry an unfair advantage. That simple but fundamental principle is being broken...High-frequency trading isn't providing more efficient, liquid markets; it is a technological arms race designed to pick the pockets of legitimate market participants...A simple solution would be to establish cancellation fees to discourage the practice of quote stuffing. The SEC and CFTC floated the idea last year. It has great merit. Make the fees high enough and they will eliminate high-frequency trading entirely. But if the practice is simply a scam, as we believe it is, an even better solution is to simply make it illegal. And exchanges should be neutral in the market. They should stop the practice of selling preferential access or data feeds and eliminate order types that allow high-frequency traders to jump ahead of legitimate order flow. These are all simply tools for scamming individual investors."
Do you agree?
Market Call: DEPENDS on employment data
Date: 4 April 2014
No comments:
Post a Comment