1 May 2014 AMC- Market ended flat ahead of employment data. Nasdaq held the rest of the indices up.
Market Summary

European
Markets Closing Prices
European
markets are now closed; stock markets across Europe performed as follows:
·
UK's FTSE: + 0.4%
·
Germany's DAX: Closed
·
France's CAC: Closed
·
Spain's IBEX: Closed
·
Portugal's PSI: Closed
·
Italy's MIB Index:
Closed
·
Irish Ovrl Index: -0.1%
·
Greece ATHEX Composite:
Closed
Before Market Opens
S&P futures vs fair value:
-1.20. Nasdaq futures vs fair value: +4.50.
The S&P 500 futures trade one point below fair value.
In Asia, most markets were closed for Labor Day, while Japan's Nikkei advanced 1.3%. Koichi Hamada, who is an adviser to Japan's Prime Minister Shinzo Abe, discussed the recent sales tax hike, saying more easing will be in order if the impact of the tax hike becomes more pronounced.
Participants received several data points. China's Manufacturing PMI ticked up to 50.4 from 50.3 (expected 50.5). Australia's AIG Manufacturing Index fell to 44.8 from 47.9. Separately, the Export Price Index increased 3.6% quarter-over-quarter (expected 1.5%, prior -0.5%) and Import Price Index rose 3.2% quarter-over-quarter (consensus 1.8%, last -0.6%). South Korea's CPI ticked up 0.1% month-over-month (consensus 0.2%, previous 0.2%), while the year-over-year reading increased 1.5%, as expected. Separately, the trade surplus expanded to $4.46 billion from $4.17 billion (expected $4.13 billion) as imports grew 5.0% year-over-year (expected 3.5%, previous 3.6%) and exports increased 9.0% (consensus 5.2%, prior 5.1%).
·
Japan's Nikkei rallied 1.3% with support from exporters.
Fujitsu and Yamaha jumped 6.3% and 11.1%, respectively. On the downside, FANUC
lost 1.6%.
·
Hong
Kong's Hang Seng was closed for
Labor Day.
·
China's Shanghai Composite was closed for Labor
Day.
Most major European markets are
closed for Labor Day, while Great Britain's FTSE trades higher by 0.3%. In
economic data, Great Britain's Manufacturing PMI rose to 57.3 from 55.8
(expected 55.4), while Nationwide HPI increased 1.2% month-over-month
(consensus 0.7%, prior 0.5%). Separately, BoE Consumer Credit expanded to
GBP1.13 billion from GBP580 million (expected GBP600 million) and Net Lending
to Individuals increased to GBP2.90 billion from GBP2.10 billion (expected GBP2.50
billion). Also of note, Mortgage Approvals came in at 67,000 (expected 71,000,
prior 70,000) and Mortgage Lending increased to GBP1.80 billion from GBP1.50
billion (expected GBP1.50 billion).
·
Great
Britain's FTSE is higher by
0.3%. Financials outperform after Lloyds Banking Group reported better than
expected results. Lloyds leads the index with a gain of 4.8%. British Sky
Broadcasting also outperforms, up 3.6%, after posting above-consensus
results.
·
Germany's DAX is closed.
·
France's CAC is closed.
U.S. Equities
·
Equity futures suggest a
flat open as the major averages look for their fourth straight day of
gains
·
Yesterday's post-FOMC
bid lifted the DJIA to a record high close while the S&P 500 finished just
0.3% off its own record peak
·
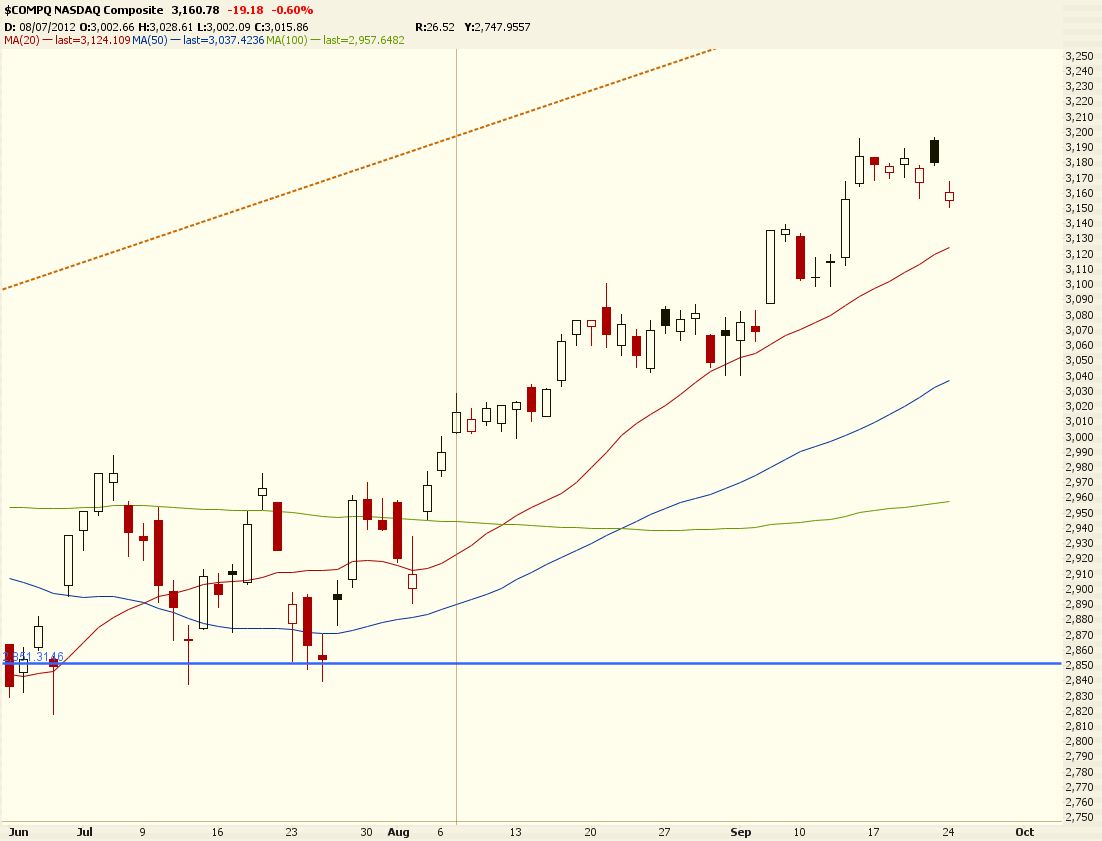
The Nasdaq holds ~6.2%
below its best level in 14 years
·
The April nonfarm
payroll report looms tomorrow morning
·
Challenger Job Cuts
(+5.7%)
·
Initial Claims (344K
actual v. 315K expected)
·
Continuing Claims (2711K
actual v. 2725K expected)
·
Personal Income (0.5%
actual v. 0.4% expected)
·
Personal Spending (0.9%
actual v. 0.6% expected)
·
PCE Prices - Core (0.2%
actual v. 0.2% expected)
o S&P Futures -1 @ 1877
o Dow Futures -5 @ 16,506
o Nasdaq Futures +5 @ 3578
Asia
·
Bourses across much of
Asia were closed for holiday
·
China's Manufacturing
PMI ticked up to 50.4 (50.5 expected, 50.3 previous), but came in
just shy of analyst estimates
·
Markets in Hong Kong and
on the Mainland were shuttered for Labor Day
·
Japan's Nikkei (+1.3%)
gained on the back of better than expected earnings
·
Australia's ASX (-0.7%)
slumped to its lowest level in two weeks
Market Internals


Market Internals -Technical-
The Nasdaq closed up 13 (+0.31%) at 4127, the S&P 500 closed down 0 (-0.01%) at 1884, and the Dow closed down 22 (-0.13%) at 16559. Action came on slightly below average volume (NYSE 682 mln vs. avg. of 730; NASDAQ 1908 mln vs. avg. of 2011), with mixed advancers/decliners (NYSE 1793/1346, NASDAQ 1260/1361) and mixed new highs/lows (NYSE 133/34, NASDAQ 59/70).
Relative Strength:
Social Media-SOCL +2.50%, Internet Composite-FDN +1.42%, Biotechnology-XBI +1.27%, Japan-EWJ +1.26%, Israel-EIS +1.09%, 20+ Year Treasuries-TLT +1.07%, Nuclear Energy-NLR +1.05%, Mexico-EWW +0.86%, Chile-ECH +0.85%, Eastern Europe-ESR +0.81%.
Relative Weakness:
Grains-JJG -2.68%, Silver Miners-SIL -2.64%, Junior Gold Miners-GDXJ -2.38%, Corn-CORN -1.82%, Natural Gas-UNG -1.66%, Vietnam-VNM -1.44%, Australia-EWA -0.91%, Nordic 30-GXF -0.69%, Russia-RSX -0.53%, Japan-EPP -0.51%.


Leaders and Laggards

Technical Updates


Briefing's Commentaries
Closing Market Summary: S&P 500
Ends Flat While Small Caps Lag
The stock market ended on a cautious note after enduring a sloppy session that lacked concerted sector leadership. The S&P 500 settled right below its flat line, while the Russell 2000 lost 0.5% after displaying intraday volatility.
Equities began the first session of May near their flat lines amid the lack of leadership from overseas as most global markets were closed for Labor Day. Despite the quiet open, small caps were active from the get-go as the Russell 2000 retreated as much as 1.1% during the first hour of action. The index halted its slide at the 200-day moving average (1113.73), which has been acting as an area of support since mid-April.
The subsequent reversal took place as fast as the early slide, placing the Russell 2000 ahead of the remaining indices. The late-morning strength began fading into the afternoon, which sent the small-cap index back towards its morning low.
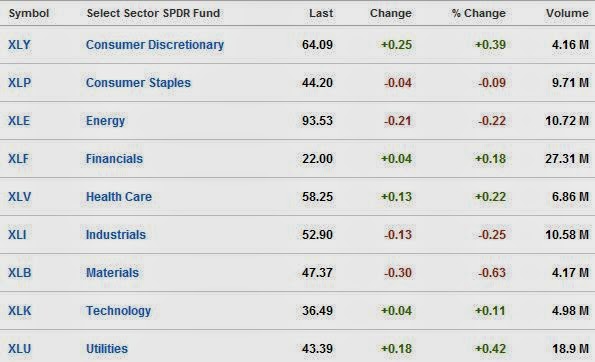
Meanwhile, the S&P 500 spent the bulk of the afternoon within four points of its flat line as individual sectors traded in mixed fashion. Most notably, consumer discretionary (+0.4%) and utilities (+0.3%) outperformed throughout the session, with the utilities sector extending its 2014 advance to 14.0%.
For its part, the discretionary sector was boosted by media names amid reports indicating AT&T (T 35.58, -0.12) approached DirecTV (DTV 80.76, +3.16) about a potential $40 billion acquisition. Momentum names also served as support to the sector as Amazon.com (AMZN 307.89, +3.76),Netflix (NFLX 336.52, +14.48), and Priceline.com (PCLN 1180.60, +22.85) jumped between 1.2% and 4.5%.
Staying on the momentum theme, high-growth names also played a part in the outperformance of the Nasdaq Composite (+0.3%). High-beta listings held up well after Yelp (YELP 64.02, +5.70) reported better than expected earnings and revenue. Another measure of support came from the shares of Facebook (FB 61.15, +1.37), which rallied 2.3% after being added to the U.S. Focus List at Credit Suisse.
Elsewhere, biotechnology climbed, which also contributed to the Nasdaq's relative strength. The iShares Nasdaq Biotechnology ETF (IBB 232.50, +2.25) gained 1.0%, while the broader health care sector ended flat. The third-largest group saw an intraday spike amid reports Pfizer (PFE 31.15, -0.13) may up its bid for AstraZeneca (AZN 81.09, +2.04).
Also of note, the leading sector from April, energy (-0.4%), finished near the bottom of the leaderboard as top component (and Dow member) ExxonMobil (XOM 101.41, -1.00) weighed. The stock lost 1.0% after beating earnings estimates on below-consensus revenue.
On the fixed income side, Treasuries rallied throughout the session, which was a bit perplexing. The benchmark 10-yr yield fell to 2.61%, settling not far above its lowest close of the year (2.58%).
That move was supported in part by the weaker than expected initial claims report, but the interesting thing was that it held up in the wake of the stronger than expected ISM Index and in front of the April employment report on Friday. The continued buying interest in the benchmark note, which has been seen all year, isn't something one would expect to see if there was a strong belief that the economy is getting ready to hit escape velocity.
Participation was a bit below average as 682 million shares changed hands at the NYSE floor.
Looking back at today's data:
The stock market ended on a cautious note after enduring a sloppy session that lacked concerted sector leadership. The S&P 500 settled right below its flat line, while the Russell 2000 lost 0.5% after displaying intraday volatility.
Equities began the first session of May near their flat lines amid the lack of leadership from overseas as most global markets were closed for Labor Day. Despite the quiet open, small caps were active from the get-go as the Russell 2000 retreated as much as 1.1% during the first hour of action. The index halted its slide at the 200-day moving average (1113.73), which has been acting as an area of support since mid-April.
The subsequent reversal took place as fast as the early slide, placing the Russell 2000 ahead of the remaining indices. The late-morning strength began fading into the afternoon, which sent the small-cap index back towards its morning low.
Meanwhile, the S&P 500 spent the bulk of the afternoon within four points of its flat line as individual sectors traded in mixed fashion. Most notably, consumer discretionary (+0.4%) and utilities (+0.3%) outperformed throughout the session, with the utilities sector extending its 2014 advance to 14.0%.
For its part, the discretionary sector was boosted by media names amid reports indicating AT&T (T 35.58, -0.12) approached DirecTV (DTV 80.76, +3.16) about a potential $40 billion acquisition. Momentum names also served as support to the sector as Amazon.com (AMZN 307.89, +3.76),Netflix (NFLX 336.52, +14.48), and Priceline.com (PCLN 1180.60, +22.85) jumped between 1.2% and 4.5%.
Staying on the momentum theme, high-growth names also played a part in the outperformance of the Nasdaq Composite (+0.3%). High-beta listings held up well after Yelp (YELP 64.02, +5.70) reported better than expected earnings and revenue. Another measure of support came from the shares of Facebook (FB 61.15, +1.37), which rallied 2.3% after being added to the U.S. Focus List at Credit Suisse.
Elsewhere, biotechnology climbed, which also contributed to the Nasdaq's relative strength. The iShares Nasdaq Biotechnology ETF (IBB 232.50, +2.25) gained 1.0%, while the broader health care sector ended flat. The third-largest group saw an intraday spike amid reports Pfizer (PFE 31.15, -0.13) may up its bid for AstraZeneca (AZN 81.09, +2.04).
Also of note, the leading sector from April, energy (-0.4%), finished near the bottom of the leaderboard as top component (and Dow member) ExxonMobil (XOM 101.41, -1.00) weighed. The stock lost 1.0% after beating earnings estimates on below-consensus revenue.
On the fixed income side, Treasuries rallied throughout the session, which was a bit perplexing. The benchmark 10-yr yield fell to 2.61%, settling not far above its lowest close of the year (2.58%).
That move was supported in part by the weaker than expected initial claims report, but the interesting thing was that it held up in the wake of the stronger than expected ISM Index and in front of the April employment report on Friday. The continued buying interest in the benchmark note, which has been seen all year, isn't something one would expect to see if there was a strong belief that the economy is getting ready to hit escape velocity.
Participation was a bit below average as 682 million shares changed hands at the NYSE floor.
Looking back at today's data:
·
The initial claims level
increased to 344,000 for the week ending April 26 from an upwardly revised
330,000 (from 329,000) for the week ending April 19. That was the highest
initial claims reading since February, while the Briefing.com consensus
expected the claims level to fall to 315,000. There were no special factors
cited for the increase, but in all likelihood, the recent volatility has
resulted from seasonal adjustment issues surrounding the Easter holiday.
·
Personal income
increased 0.5% in March after increasing an upwardly revised 0.4% (from 0.3%)
in February. The Briefing.com consensus expected income to increase 0.4%.
·
Personal spending also
topped expectations, increasing 0.9% in March after increasing an upwardly
revised 0.5% (from 0.3%) in February.
·
Core PCE prices
increased 1.2% y/y and remain well below the Fed's 2.0% target.
·
The April Challenger Job
Cuts report indicated a 6.0% year-over-year increase to follow the previous
decline of 30.2%.
·
The ISM Manufacturing
Index increased to 54.9 in April from 53.7 in March. The Briefing.com consensus
expected the ISM Manufacturing Index to increase to 54.5. The gain in the ISM
Index was in-line with the improvements reported in the regional Federal Reserve
manufacturing surveys released throughout April.
·
Construction spending
increased 0.2% in March after falling a downwardly revised 0.2% (from +0.1%) in
February. The Briefing.com consensus expected construction spending to increase
0.4%. The extreme winter weather in January and February did not lead to a
release in pent up demand, suggesting the weather effects may have been
overstated.
Tomorrow, the Nonfarm Payrolls
report for April (Briefing.com consensus 210,000) will be released at 8:30 ET,
while March Factory Orders (consensus 1.6%) will be announced at 10:00 ET.
·
S&P 500 +1.9%
YTD
·
Dow Jones Industrial
Average -0.1% YTD
·
Nasdaq Composite -1.2%
YTD
·
Russell 2000 -3.0% YTD
Commodities
Closing Commodities: Natural Gas
Falls 2.3% Following Inventory Data, Gold Loses 1%
·
June gold traded in
negative territory after the FOMC announced yesterday that it would continue
its tapering path and reiterated an upbeat outlook for the economic future of
the U.S. The yellow metal dipped to a session low of $1277.30 per ounce and eventually
settled with a 1.0% loss at $1283.40 per ounce.
·
July silver also chopped
around in the red. It fell as low as $18.86 per ounce, its lowest level since
July 2013, and settled with a 0.7% loss at $19.03 per ounce.
·
June crude oil extended
yesterday's losses as the dollar index traded slightly higher. The energy
component touched a session low of $98.80 per barrel when pit trade opened and
inched higher until late morning action. It brushed a session high of $99.91
per barrel and eventually settled with a 0.3% loss at $99.48 per barrel.
·
June natural gas fell
deeper into negative territory following bearish inventory data. The EIA
reported that for the week ending Apr 25, inventories showed a build of 82 bcf
when a smaller build of 75-77 bcf was anticipated. It sold-off from a session
high of $4.81 per MMBtu and settled at its session low of $4.71 per MMBtu,
booking a loss of 2.3%.
COMEX
Metals Closing Prices
June gold fell $12.60 to $1283.40/oz
·
Gold traded in negative
territory after the FOMC announced yesterday that it would continue its
tapering path and reiterated an upbeat outlook for the economic future of the
U.S. The yellow metal dipped to a session low of $1277.30 and eventually
settled with a 1.0% loss.
July silver fell $0.13 to $19.03/oz
·
Silver also chopped
around in the red as the dollar index traded slightly higher. It fell as low as
$18.86, its lowest level since July 2013, and settled with a 0.7% loss.
July
copper fell 1 cent to $3.02/lbs
CBOT
Agriculture and Ethanol/ICE Sugar Closing Prices
·
July corn fell 12 cents
to $5.07/bushel
·
July wheat fell 13 cents
to $7.09/bushel
·
July soybeans fell 51
cents to $14.61/bushel
·
May ethanol fell 9 cents
to $2.17/gallon
·
July sugar (#16 (U.S.))
rose 0.08 of a penny to 24.53 cents/lbs
NYMEX
Energy Closing Prices
June crude oil fell $0.30 to $99.48/barrel
·
Crude oil extended
yesterday's losses as the dollar index traded slightly higher. The energy
component touched a session low of $98.80 when pit trade opened and inched
higher until late morning action. It brushed a session high of $99.91 and
eventually settled with a 0.3% loss.
June natural gas fell 11 cents to $4.71/MMBtu
·
Natural gas fell deeper
into negative territory following bearish inventory data. The EIA reported that
for the week ending Apr 25, inventories showed a build of 82 bcf when a smaller
build of 75-77 bcf was anticipated. It sold-off from a session high of $4.81
and settled with a 2.3% loss at its session low.
June heating oil fell 2 cents to $2.91/gallon
June
RBOB fell 2 cents to $2.94/gallon
Treasuries
Yields Slide to Multi-Month Lows:
10-yr: +10/32..2.610%..USD/JPY: 102.29..EUR/USD: 1.3865
·
Treasuries finished just
off their best levels, pushing yields to multi-month lows. Click
here to see an intraday yields chart.
·
A sleepy overnight
session saw yields firm into the cash open, and remain near their overnight
highs following the strong personal income (0.5% actual v. 0.4%
expected) and spending (0.9% actual v. 0.6% expected) data.
·
It wasn't until the mixed
ISM Index (54.9 actual v. 54.5 expected) and construction spending (0.2% actual
v. 0.4% expected) that the buying got started and then persisted
throughout the remainder of the session.
·
The 30y shed -5.3bps to
finish @ 3.405%. Today's settlement marked the lowest in more than 10
months as action closed the June 19/20 gap.
·
The 10y fell -4.2bps to
2.606%, closing at its lowest level in three months. The benchmark
yield finished on the lower bound of the 2.600%/2.800% range that has held up
since the beginning of February.
·
A -2.8bp decline dropped
the 5y to 1.653% where action closed on support helped by the 50 and 100 dma.
The recent failure to retest the early April highs near 1.800% has to be a bit
disconcerting for Treasury bears.
·
Today's
bid flattened the yield curve as the 5-30-yr spread tightened to 175bps.
·
Precious metals pared
some of their losses as gold fell -$11 to $1285 and silver slumped -$0.13 to
$19.04.
·
Data: Nonfarm payrolls, nonfarm private payrolls,
unemployment rate, hourly earnings, average workweek (8:30), and factory orders
(10).
Next Day In View

Economic Commentary
Economic Summary: Spending outpaces
income in March; ISM slightly tops expectations; NFP's tomorrow at 8:30
Economic Data Summary:
Economic Data Summary:
·
April Challenger Job
Cuts 5.7% vs Briefing.com consensus of ; March was -30.2%
·
Weekly Initial Claims
344K vs Briefing.com consensus of 315K; Last Week was revised to 330K
from 329K
·
Weekly Continuing Claims
2.771 M vs Briefing.com consensus of 2.752 M ; Last Week was revised to 2.674 M
from 2.680 M
o Over the past four weeks, the initial claims
level has increased steadily by a total of 43,000. Meanwhile, the DOL reported
that there were no special factors associated with recent increase in claims.
If that was true, then labor conditions have softened notably throughout the
month of April. The DOL typically has problems with the seasonal adjustments
around holidays that move on the calendar. In this case, the late Easter
holiday likely caused undue biases in the claims data.
·
March
Personal Income 0.5% vs Briefing.com consensus of 0.4%; February was revised to
0.4% from 0.3%
·
March
Personal Spending 0.9% vs Briefing.com consensus of 0.6%; February was revised
to 0.5% from 0.3%
o . The March personal income and spending data
were already incorporated in yesterday's advance Q1 2014 GDP release. The only
new information was the size of the revisions to the February data. As expected
from the March retail sales report, those revisions were substantial and growth
in February was far stronger than originally reported. Wages and salaries
increased 0.6% in March, up from a 0.3% increase in February and in-line with
the 0.7% increase in aggregate earnings reported in the March employment
report. P
·
March PCE Prices -- CORE
0.2% vs Briefing.com consensus of 0.2%; February was 0.1%
·
April
ISM Index 54.9 vs Briefing.com consensus of 54.5; March was 53.7
o The gain in the ISM Index was in-line with
the improvements reported in the regional Federal Reserve manufacturing surveys
released throughout April. Production levels decelerated slightly as the
related index fell to 55.7 in April from 55.9 in March. New orders growth was
flat with the index remaining at 55.1. The order backlogs index fell 2.0 points
to 55.5. Employment levels accelerated as the related index increased to 54.7
in April from 51.1 in March.
·
April
Construction Spending 0.2% vs Briefing.com consensus of 0.4%; March was revised
to -0.2% from 0.1%
o Private construction increased a solid
0.5% in March after falling 0.2% in February. Private residential construction
increased 0.8% in March after reporting no growth in February. Spending on new
structures increased 0.8% while spending on home improvement projects increased
0.6%. Neither of these results conform with the -5.7% first quarter decline in
residential investment spending reported in the GDP report. Residential
construction growth will likely be revised up in the second estimate.
Upcoming Economic Data:
·
April
Nonfarm Payrolls due out Friday at 8:30 (Briefing.com consensus of 210K; March
was 192K)
·
April
Nonfarm Private Payrolls due out Friday at 8:30 (Briefing.com consensus of
205K; March was 192K)
·
April Unemployment Rate
due out Friday at 8:30 (Briefing.com consensus of 6.6%; March was 6.7%)
·
April Hourly Earnings
due out Friday at 8:30 (Briefing.com consensus of 0.2%; March was 0.0%)
·
April Average Workweek
due out Friday at 8:30 (Briefing.com consensus of 34.5; March was 34.5)
·
March Factory Orders due
out Friday at 10:00 (Briefing.com consensus of 1.6%; February was 1.6%)
Other International Events of
Interest:
·
China's Manufacturing
PMI ticked up to 50.4 from 50.3 (expected 50.5).
On other news....
Currencies
Dollar Holds Near Three-Week Lows:
10-yr: +12/32..2.601%..USD/JPY: 102.28..EUR/USD: 1.3870
·
The Dollar Index drifts
little changed near 79.50 amid a rather uneventful session. Click here to see a daily Dollar
Index chart.
·
Today's action has been
limited to a 10 cent range as traders around much of the world
celebrated the May Day holiday.
·
EURUSD is +5 pips @ 1.3870 as action attempts
to put in its best close in three weeks. The single currency saw an
early test of the 1.3900 level, but failed to see a follow through bid amid a
sleepy holiday trade. Eurozone data out tomorrow includes the unemployment rate
and Spanish and Italian Manufacturing PMI.
·
GBPUSD is +20 pips @ 1.6895 as buyers remain in control
for a fourth session. Sterling has benefitted from this morning's trio
of better than expected data (Manufacturing PMI, Nationwide Home Price Index,
Net Lending to Individuals), and looks likely to close at its best levels since
August 2009. The 100 mma is likely to provide some headwinds in the
1.6970 region. Britain's Construction PMI is set for tomorrow.
·
USDCHF is -10 pips @ .8785 as trade flirts with its
lowest close in three weeks. All in all, today's session has been lackluster,
limited to just a 20 pip range. Switzerland's SVME PMI will cross the wires
tomorrow.
·
USDJPY is +5 pips @ 102.25 as a sleepy session draws to
a close. The pair saw an early attempt at retaking the 102.50 pivot, but trade
was rebuffed by the 50 dma (102.40). A breakdown of minor support in the 102.00
region puts the key 101.00/101.25 level in play. Japanese data is limited to
household spending.
·
AUDUSD is -10 pips @ .9275 as action has reversed most
of yesterday's gains. The hard currency saw an early bid following the hotter
than expected import prices data lift action above the .9300 level, but trade
has since slipped back onto near-term support. Australia's PPI is scheduled for
this evening. Chinese banks remain closed in observance of Labor Day.
·
USDCAD is +5 pips @ 1.0965 as trade has given up all of
its early gains. The pair tested resistance in the 1.1000 area, but bulls are
now hoping to be able to hold the 100 dma (1.0967). Support in the 1.0850 area
is likely all that stands in the way of a retest of the 200 dma (1.0692).
Jason's Commentaries
The market was held up by Nasdaq as Priceline, Amazon and other tech components gained. It was a rather volatile session last night, started bearish, then turned bullish then bearish again. At closing, it was flat. Volumes were at 698m shares traded on the NYSE. Seems pretty high for a day before employment data. Internals were showing some bearish signs in the market last night. Well, as the Dow and S&P500 is at their resistance, the market remains wary of the infamous Sell-in-May. The employment data could be a game changer, that might spark off the sell in may if the market did not perceive it as a good news. Let's see how the market end up after the employment data.
Market Call: DOWN
Date: 2 May 2014
No comments:
Post a Comment